
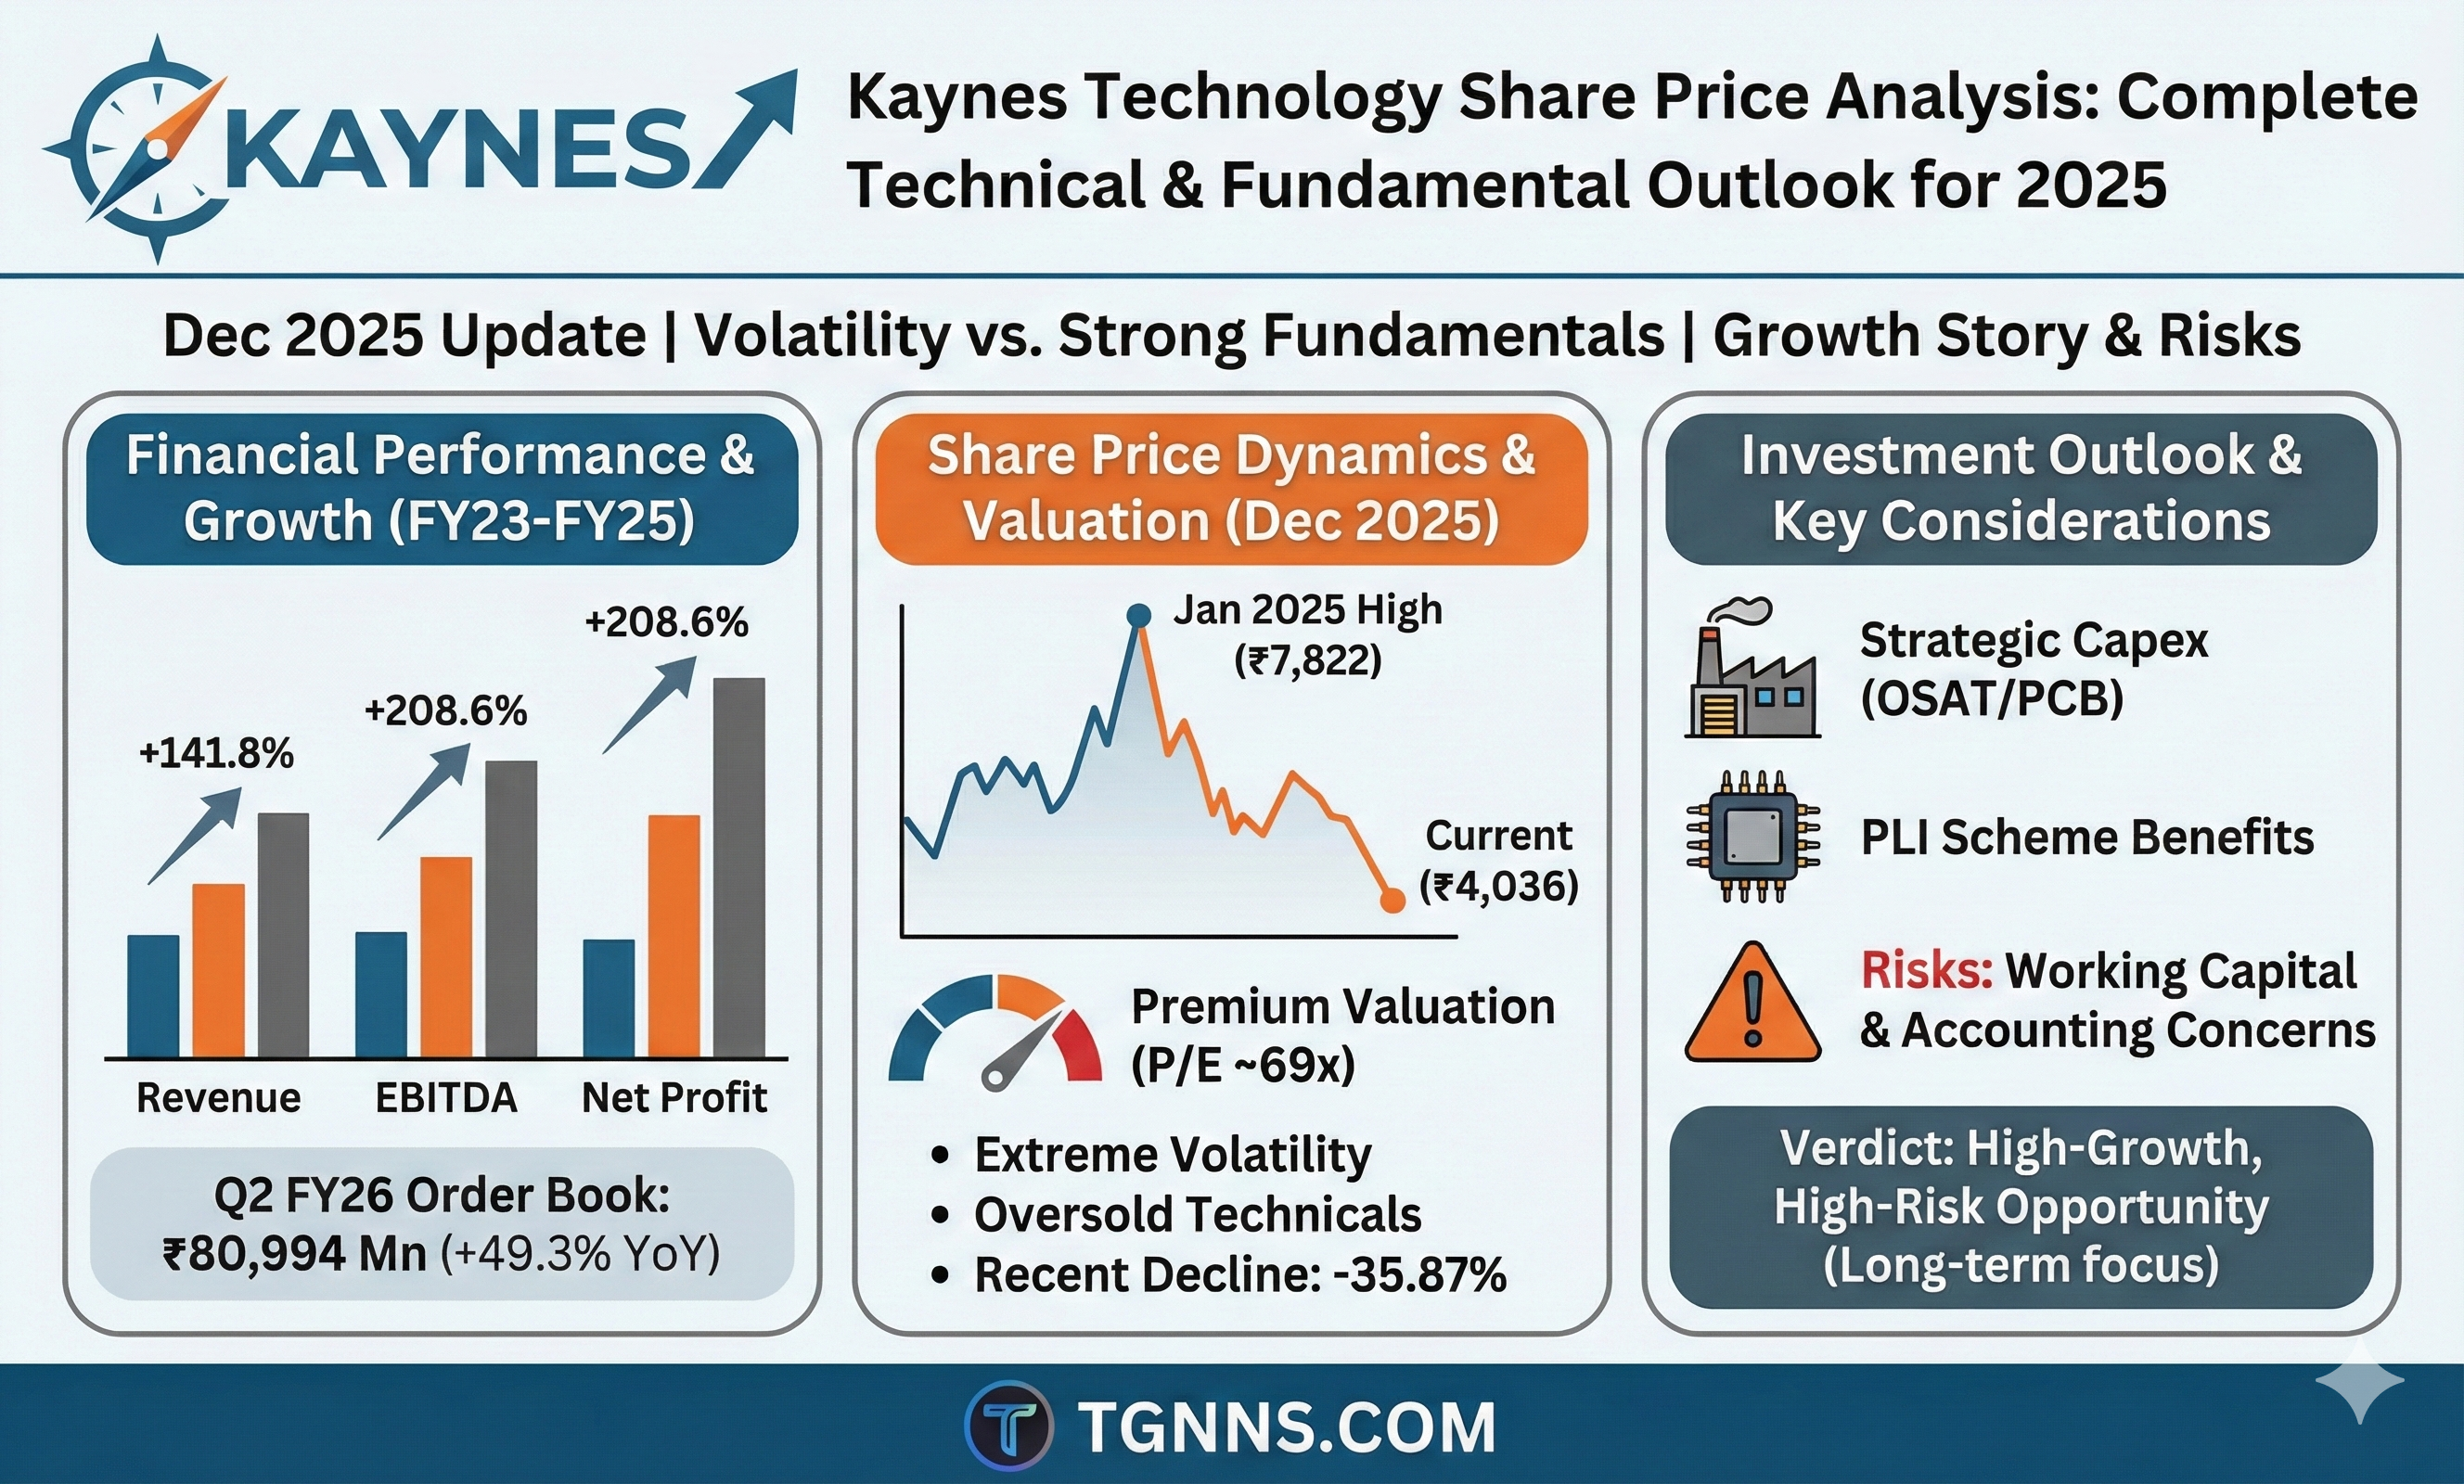
Kaynes Technology India Limited (KAYNES) represents a compelling case study in the Indian electronics manufacturing sector. The company, trading on the NSE under the ticker KAYNES.NS, has experienced dramatic volatility over the past year, with its stock price declining 35.87% from ₹6,294.60 to ₹4,036.50 despite maintaining robust fundamental growth. This comprehensive analysis examines the current share price dynamics, technical indicators, financial performance, and investment considerations for traders and investors evaluating Kaynes Technology’s potential in December 2025.
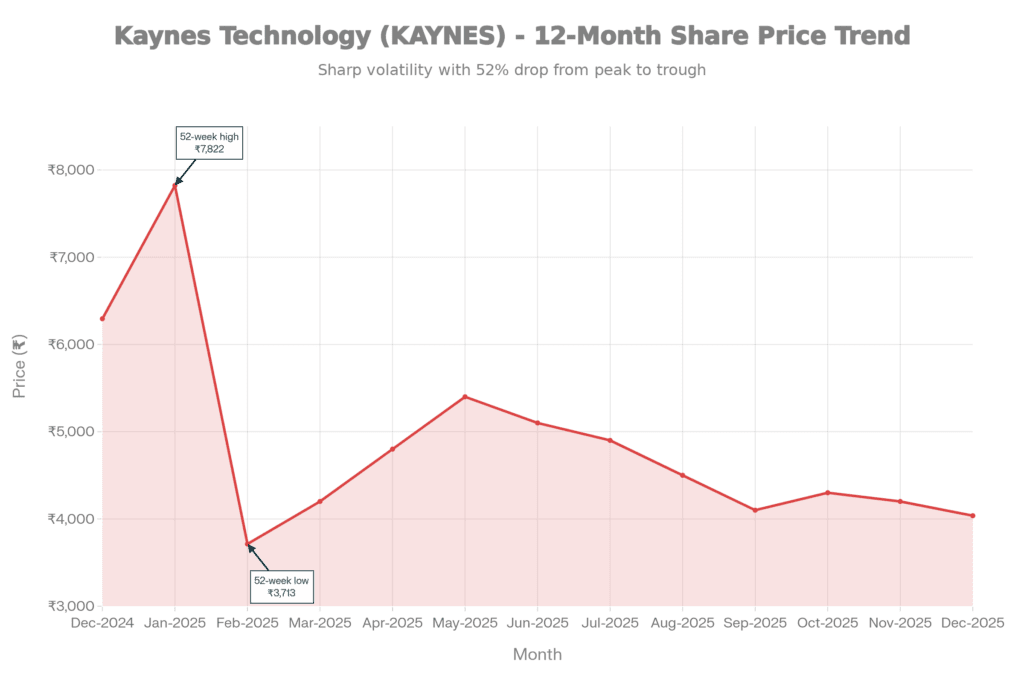
Kaynes Technology 12-Month Share Price Trend showing peak in January 2025 and significant decline thereafter
Understanding Kaynes Technology’s Business Model and Growth Story
Core Business Operations and Revenue Streams
Kaynes Technology India Limited operates as a comprehensive Electronics Manufacturing Services (EMS) provider with specialized capabilities in printed circuit board assemblies (PCBAs), box build solutions, and original equipment manufacturer (OEM) services. The company serves multiple high-growth industrial verticals, positioning itself as a critical infrastructure player in India’s push toward domestic electronics manufacturing and self-reliance.
The company’s business model encompasses several strategic revenue streams that collectively generate exceptional financial performance. Contract manufacturing constitutes approximately 75% of revenue, representing the core earnings driver for Kaynes Technology. Additional revenue streams include design and development services, licensing and royalties, and after-sales support services. As of the latest earnings call, the company operates 12 manufacturing sites across India with facilities extending to the United States, Canada, and Austria, serving over 50 major clients across aerospace, defense, automotive, and telecommunications sectors.
Key Business Verticals Driving Growth
The automotive sector represents the single largest revenue contributor, accounting for approximately 50% of operational revenue. This includes both electric vehicle (EV) and internal combustion engine (ICE) customer solutions encompassing lighting systems, electronic control units (ECUs), battery management systems, and cluster modules. Beyond automotive, Kaynes has established significant market positions in railway signalling systems, smart meter manufacturing (approximately 20% of India’s total production), medical devices, IT and IoT products, and high-performance computing servers.
The company’s strategic expansion into aerospace manufacturing marks a pivotal growth vector for future profitability. In July 2025, Kaynes approved acquisitions worth ₹44.72 crore, including 76% stakes in Aerocaliph Components and Cryo Precision Technologies—both aerospace manufacturing firms—alongside an 11.13% investment in Tranzmeo IT Solutions, a deep-tech company specializing in fiber-optic sensing networks. This inorganic expansion strategy reflects management’s confidence in capitalizing on India’s rapidly growing aerospace sector and deep-tech opportunities.
Recent Financial Performance: Fundamentals vs. Market Sentiment
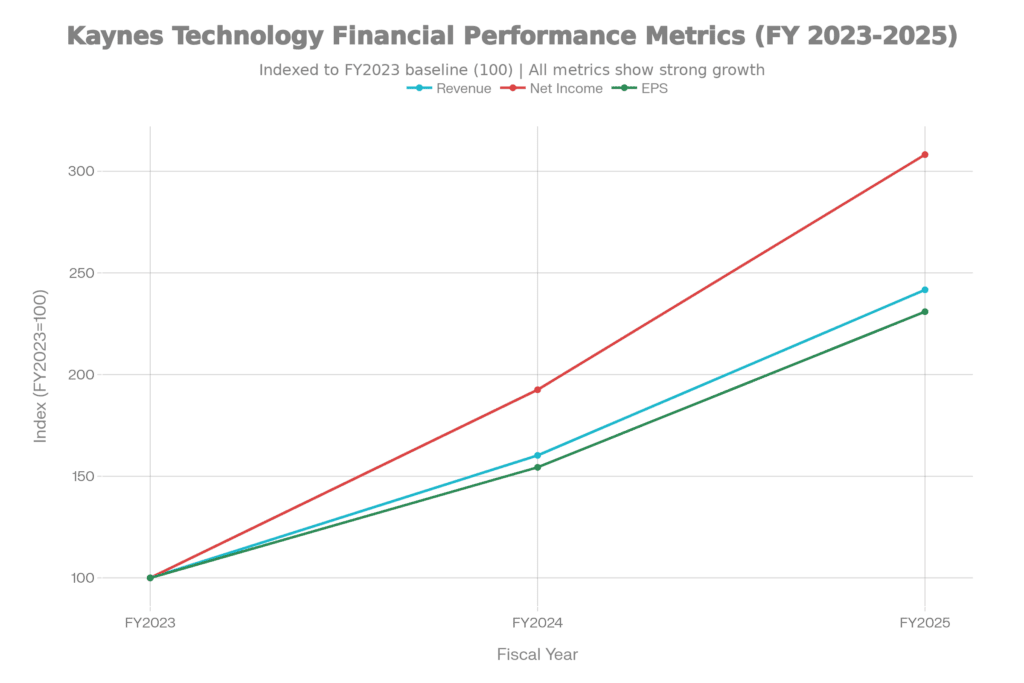
Kaynes Technology’s strong revenue and profitability growth from FY2023 to FY2025, showing robust fundamental strength despite recent stock price volatility
Exceptional Earnings Growth Metrics
Despite the stock’s significant price decline, Kaynes Technology’s financial performance remains extraordinarily strong. The company has delivered impressive compounded annual growth rates across all profitability metrics. Over the past three fiscal years, the company achieved revenue growth of 141.8%, net profit expansion of 208.6%, and earnings per share (EPS) growth of 131%.
For the most recent fiscal year (FY2025), Kaynes Technology reported total revenue of ₹27,218 million, demonstrating year-on-year growth of 50.82%. Gross profit surged to ₹8,220 million, increasing 73.18% year-on-year, while EBITDA reached ₹4,107 million with 66.94% growth. Most impressively, net profit achieved ₹2,934 million, representing 60.09% year-on-year expansion, with a solid net profit margin of 11.74%.
The H1 FY26 results (half-year to September 2025) reinforce this positive trajectory. H1 FY26 revenue stood at ₹15,797 million, demonstrating 47% year-on-year growth. Operating EBITDA increased 75% year-on-year to ₹2,610 million, with EBITDA margin expansion of 270 basis points to 16.5%. Profit after tax reached ₹1,960 million, corresponding to 12.4% PAT margin.
Profitability Ratios and Operational Efficiency
Kaynes Technology exhibits excellent profitability characteristics with trailing twelve-month (TTM) return on equity of 12.17% and return on assets of 8.02%. The company’s operating profit margin stands at 33.73% TTM, reflecting strong operational leverage and pricing power. EBITDA margin improved to 19.79% TTM, expanding 1069 basis points year-on-year, demonstrating enhanced operational efficiency and cost management.
The company’s EPS growth has been particularly impressive. TTM EPS reached ₹58.44, increasing 49.59% year-on-year. For FY2025, the company reported EPS of ₹45.82, compared to ₹30.63 in FY2024 and ₹19.84 in FY2023, indicating exceptional shareholder value creation.
Order Book and Future Revenue Visibility
One of the most bullish indicators for Kaynes Technology is its robust order book strength. The Q2 FY26 order book stood at ₹80,994 million, compared to ₹54,228 million in Q2 FY25, representing 49.3% year-on-year growth. The company reported a total order pipeline of approximately ₹8,000 crores, with monthly order inflow exceeding first quarter levels, signifying healthy business momentum.
Management guidance suggests expected revenue volumes in the second half of FY26 will increase more than 50-60% compared to first half volumes, with the company explicitly targeting revenue exceeding ₹3,000 crores for FY25 and maintaining EBITDA margins of 15%.
Kaynes Technology Share Price Analysis: Current Valuation and Technical Setup
Price Performance and Volatility Metrics
Kaynes Technology’s share price has experienced extreme volatility over the past 12 months. The stock achieved its 52-week high of ₹7,822.00 on January 1, 2025, reflecting investor optimism regarding growth prospects. However, subsequent developments triggered a significant correction, with the stock declining to a 52-week low of ₹3,712.50 on February 11, 2025. As of December 9, 2025, the stock trades at ₹4,036.50, representing a year-to-date decline of 48.38% from its January peak.
Over the past one month alone, the stock has experienced a sharp 31% decline, significantly outpacing the 2.3% increase in the BSE Sensex. Trading volume has surged dramatically, with combined NSE and BSE transactions exceeding 7.9 million shares on certain days, indicating heightened investor interest and potential panic selling.
Critical Price Levels and Support-Resistance Zones
Technical analysis reveals several important price levels traders should monitor closely. The pivot point currently stands at approximately ₹4,029, serving as the central reference point for market sentiment. Immediate resistance levels are positioned at:
- First Resistance (R1): ₹4,308
- Second Resistance (R2): ₹4,809
- Third Resistance (R3): ₹5,088
Conversely, support levels are established at:
Weekly technical analysis provides a broader perspective, with resistance levels extending to ₹5,151, ₹5,949, and ₹6,369. The stock’s weekly pivot point is positioned at ₹4,731, suggesting potential recovery could initially target the ₹5,000-5,200 zone.
Technical Indicators: Momentum and Trend Analysis
Relative Strength Index (RSI) readings present a paradoxical picture. The 14-period RSI currently stands at 9.14 on daily timeframe, indicating an extremely oversold condition well below the 25 threshold that traditionally signals oversold status. Weekly RSI of 25.99 similarly suggests severe oversold positioning. Historically, RSI readings this extreme have preceded significant reversals.
Moving Average Analysis reveals that the stock is trading significantly below all major moving averages:
| Moving Average Period | Daily SMA | Signal |
|---|---|---|
| 5-Day | ₹4,770.80 | Downtrend |
| 20-Day | ₹5,661.22 | Downtrend |
| 50-Day | ₹6,425.48 | Downtrend |
| 100-Day | ₹6,400.90 | Downtrend |
| 200-Day | ₹5,880.96 | Downtrend |
The stock’s position below the 200-day moving average of ₹5,880.96 indicates a significant long-term downtrend, with the price currently trading approximately 31.3% below this critical support level.
MACD (Moving Average Convergence Divergence) indicators currently show negative readings across multiple timeframes. The daily MACD stands at -538.91, well below the zero line, indicating strong bearish momentum. However, such extreme negative MACD readings often precede mean reversion, particularly when combined with oversold RSI conditions.
Stochastic Oscillator readings of 2.05 on daily charts confirm the oversold status, with the stock trading at the extreme lower bound of its recent trading range, historically a precursor to bounce-back action.
Bollinger Band Analysis and Volatility
Kaynes Technology is trading significantly below its 20-day Bollinger Band, with the lower band at ₹4,334.17 and the upper band at ₹6,988.28. The stock’s position near the lower Bollinger Band suggests mean reversion potential, as prices at the extremes historically tend to revert toward the middle band, currently at ₹5,661.22. The extreme volatility (represented by the wide band width of ₹2,654) indicates expanded trading ranges, providing significant potential for substantial moves in either direction.
Valuation Analysis and Comparative Market Assessment
Price-to-Earnings (P/E) Ratio and Earnings Quality
Kaynes Technology currently trades at a trailing P/E ratio of 69.33 and forward P/E of 136.6, positioning the stock in the premium valuation territory relative to its historical trading ranges. However, these elevated multiples must be contextualized within the company’s extraordinary growth profile and recent stock price decline.
For perspective, at the current ₹4,036.50 price and FY2025 EPS of ₹45.82, the implied valuation multiple is approximately 88x earnings on a trailing basis. While this appears expensive in absolute terms, it warrants comparison to peer EMS manufacturers and growth expectations. The market cap currently stands at ₹271.16 billion, down significantly from peak valuations exceeding ₹440 billion earlier in the year.
Forward Earnings Power and PEG Ratio
When evaluated on forward earnings, assuming the company achieves management’s FY2025 revenue guidance of ₹3,000+ crores and 15% EBITDA margins, implied net profit would approximate ₹450 crores (₹4,500+ crore revenue at 11-12% net margins), translating to approximately ₹70-75 EPS. At current prices, this would represent a forward P/E of approximately 54-57x, more reasonable for a company delivering 50%+ annual earnings growth.
Applying the PEG ratio (Price/Earnings-to-Growth), which divides P/E by growth rate, provides additional perspective. With the company growing earnings at 50-60% annually while trading at 88x trailing P/E, the implied PEG ratio is approximately 1.5-1.8. While above the ideal 1.0 threshold, this is reasonable for a high-growth, high-quality EMS manufacturer in a secular growth industry.
Recent Catalysts and Market Concerns: Understanding the Price Decline
Disclosure Quality and Accounting Concerns
The significant stock decline in early December 2025 has been attributed to concerns regarding disclosure quality and accounting practices. Global brokerage firm Investec highlighted three concerning trends: weak performance of the core EMS business (with growth led by the acquired Iskraemeco smart meter business), higher working capital troubles, and limited investments completed in OSAT/PCB manufacturing facilities despite announced plans.
The company’s contingent liabilities increased to ₹520 crores (18% of net worth), with major additions including performance bank guarantees of ₹96.8 crore for Iskraemeco projects and corporate guarantees of ₹132.5 crore issued to subsidiaries (₹122.5 crore for Kaynes Electronics, ₹70 crore for Iskraemeco). Management clarified these were necessitated due to funding requirements following the Iskraemeco acquisition.
Brokerage Recommendations and Price Targets
Investec maintains a “SELL” rating on Kaynes Technology with a price target of ₹5,760, implying 42.6% upside from current levels but reflecting the brokerage’s concerns regarding balance sheet deterioration. The analyst values the company’s core FY27 business at 55x P/E, which Investec considers “rich” for an EMS business.
JPMorgan retained an “Overweight” rating with a ₹7,550 price target (implying 87% upside), but cautioned investors against “bottom fishing” at current levels, citing “unresolved issues surrounding balance and cash flow, as well as the company’s questionable accounting.” JPMorgan specifically noted the stock lacks clear, strong catalysts until Q3 earnings, likely referring to Q3 FY26 results expected in January/February 2026.
Working Capital Management and Cash Flow Concerns
Despite strong profitability growth, management acknowledged the occurrence of operating cash flow decreasing over the past three years, a potential concern for a manufacturing company typically expected to generate strong free cash flow from operations. This working capital deterioration, likely related to the significant growth and operational expansion phase, represents a key area for investor scrutiny and management guidance.
Forward-Looking Catalyst Analysis and Investment Thesis
Mega Capex Projects and Long-Term Value Creation
Kaynes Technology is executing an ambitious ₹600+ million capex program that, while currently weighing on balance sheets and cash flow metrics, positions the company for substantial future margin expansion. The company is investing:
- ₹400 million in Kaynes Semicon (Sanand) for OSAT (Outsourced Semiconductor Assembly and Testing) capacity
- ₹120 million in Kaynes Circuits (Chennai) for multilayer HDI (high-density interconnect) PCB manufacturing
- Additional plants for smart meters, high-performance computing servers, and strategic geographies
These investments directly address India’s import dependence on semiconductors and PCBs, aligning with government initiatives and representing first-mover advantages for Kaynes Technology. Management guidance suggests these facilities will reduce Bill of Materials (BoM) costs, improve lead times, and provide proprietary competitive advantages.
Government Support and PLI Scheme Benefits
The Production Linked Incentive (PLI) Scheme remains a critical enabler for Kaynes Technology’s growth trajectory. Management explicitly stated that government push for domestic electronics manufacturing through various PLI schemes represents key enablers for the company’s expansion plans. The company expects to capture meaningful portions of the India PCB market, expected to grow at 20% CAGR, driven by EV demand, industrial automation, defense, and telecom sectors.
Strategic Acquisitions and Synergy Realization
The Iskraemeco acquisition (Europe’s largest smart meter manufacturer) provided immediate entry into smart metering markets but has consumed management bandwidth and capex resources. Post-integration, the company expects meaningful synergy realization through consolidated purchasing power, cost structure rationalization, and cross-selling opportunities. Similarly, the August Electronics acquisition in Canada provides new customer access and technology capabilities, extending geographic diversification.
Technical Trading Outlook and Support-Resistance Scenarios
Bullish Scenario: Reversal from Oversold Conditions
If Kaynes Technology rebounds from current oversold conditions—supported by improving RSI readings, moving average crossovers, and potential catalyst from Q3 FY26 earnings—the stock could face initial resistance at:
- ₹4,700-4,800 (R2 level), where profit-taking may emerge
- ₹5,200-5,400 (previous support zone), representing mean reversion toward 50-day SMA
- ₹6,000-6,200 (former resistance zone), where the 100-day and 200-day SMA converge
- ₹6,800-7,000 (psychological level), representing recovery toward end-of-year levels
Recovery to ₹5,200-5,400 (35-40% upside) appears achievable if brokerages upgrade recommendations following Q3 earnings clarity on balance sheet stabilization and working capital management.
Bearish Scenario: Further Deterioration
Conversely, if concerns regarding accounting quality and balance sheet health escalate without management clarification, the stock could deteriorate toward:
- ₹3,500-3,600 (previous support), representing additional 13-15% downside
- ₹3,000-3,200 (significant floor), likely triggering institutional accumulation
- ₹2,500-2,700 (panic selling zone), historically associated with major bottoms
Risk factors include further deterioration in working capital metrics, inability to execute capex plans as scheduled, or significant Iskraemeco operational challenges.
Comparative Valuation: KAYNES vs. Indian EMS Peers
| Metric | Kaynes (KAYNES) | Industry Context |
|---|---|---|
| Revenue CAGR (3Y) | 55.5% | Above-average for EMS |
| Net Profit CAGR (3Y) | 75.8% | Exceptional profitability growth |
| Trailing P/E | 88x | Premium valuation |
| Forward P/E | 54-57x | Reasonable for growth profile |
| EV/EBITDA | ~20x | Above-peer average |
| Market Cap | ₹271 Cr | Mid-cap positioning |
| 52-week Performance | -35.87% | Significant underperformance vs. indices |
Kaynes Technology’s profitability growth significantly exceeds peer averages, justifying premium valuation multiples. However, peer companies with similar growth profiles typically trade at 40-50x forward P/E, suggesting 15-35% downside adjustment remains possible if growth deceleration occurs or 25-50% upside if near-term catalysts accelerate stock recovery.
Conclusion and Investment Recommendation Framework
Kaynes Technology presents a complex investment opportunity characterized by exceptional fundamental growth, reasonable long-term value proposition, and significant near-term headline risk. The year-to-date 48% stock price decline has created a significant disconnect between the company’s underlying operating performance and market valuation.
Key Takeaways for Different Investor Profiles
For Value Investors: The current price of ₹4,036.50 appears compelling for investors with a 3-5 year investment horizon. The company’s 142% revenue growth and 209% net profit growth over three years provides strong evidence of sustainable competitive advantages and market opportunity. The oversold technical indicators (RSI 9.14, MACD -538) combined with 50%+ earnings growth typically precedes meaningful recovery.
For Growth Investors: The ₹3,000+ crore revenue target and 15% EBITDA margin guidance suggest compound annual growth rates of 30-40% over the next 3-5 years are achievable. The strategic investments in OSAT and PCB manufacturing, government PLI support, and order book strength provide multiple growth vectors.
For Traders: The extreme technical oversold conditions present tactical trading opportunities. The RSI reading of 9.14 represents one of the most extreme oversold conditions in the stock’s trading history. Initial resistance targets of ₹4,500-4,700 and ₹5,200-5,400 represent reasonable near-term objectives, with risk defined below ₹3,500-3,600 support.
Risk Management Imperative: Investors must remain cognizant of disclosed balance sheet concerns, working capital deterioration, and contingent liabilities expansion. Near-term catalysts and management guidance during Q3 FY26 earnings (expected January/February 2026) will be critical in determining whether the stock reprices higher or sustains further pressure.
The comprehensive analysis demonstrates that Kaynes Technology represents a high-growth, high-quality electronics manufacturing business trading at potentially attractive valuations after its recent 35% decline. However, the near-term stock performance will likely be heavily influenced by balance sheet improvement evidence and working capital management clarity rather than fundamental growth metrics alone. Investors should position accordingly based on individual risk tolerance, investment horizon, and conviction in management’s strategic execution capabilities.