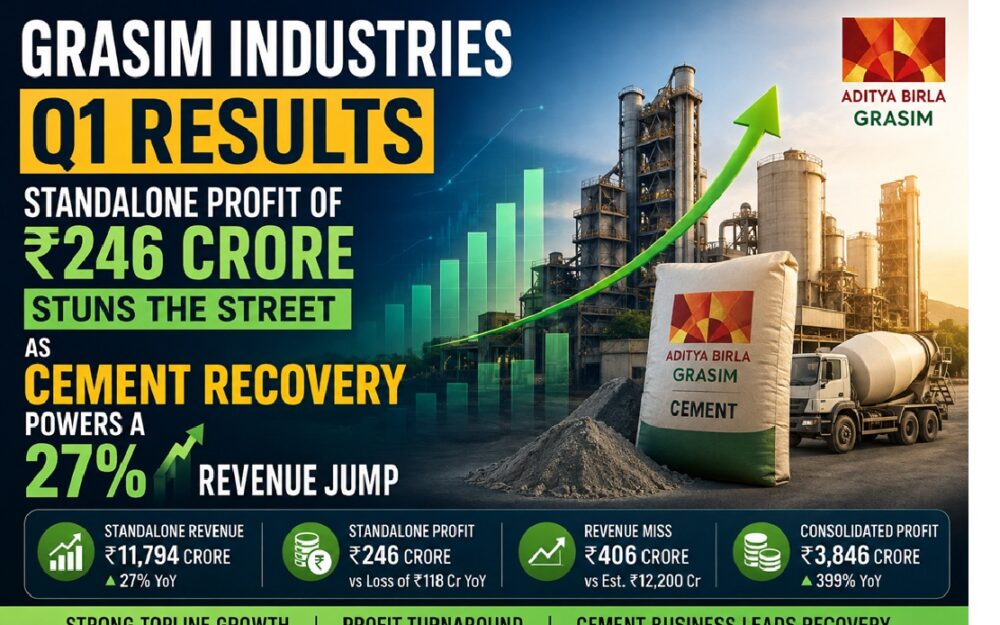
Grasim Industries has finally put its Q1 numbers on the table, and the market got something it did not expect. Analysts had pencilled in another quarter of losses at the standalone level. Instead, the company delivered a profit. Revenue came in slightly below street estimates, but the profit line more than made up for it. Below, I break down every figure — standalone and consolidated, year-on-year and quarter-on-quarter — and explain what these results actually signal about the business.
Quick Snapshot: What Grasim Reported This Quarter
Before we go deep, here is the headline view of the quarter:
- Standalone revenue from operations: ₹11,794 crore, up roughly 27% year-on-year from ₹9,223 crore
- Sequential revenue: essentially flat versus ₹11,774 crore in the preceding quarter
- Street estimate for revenue: around ₹12,200 crore — so a modest miss
- Standalone net profit: ₹246 crore, versus a loss of ₹118 crore a year earlier and a loss of ₹163 crore in the previous quarter
- Street estimate for profit: a loss of roughly ₹45 crore — the actual result beat that by nearly ₹291 crore
- Standalone EPS: ₹3.64, against –₹1.74 a year ago and –₹2.41 sequentially
- Consolidated revenue: ₹48,716 crore, up sharply year-on-year but down sequentially
- Consolidated net profit: ₹3,846 crore, up from ₹770 crore a year ago and ₹3,684 crore in the previous quarter
In one line: the topline slightly undershot, the bottom line overshot, and the loss-making standalone entity swung firmly into the black.
Why the Standalone Numbers Deserve Your Attention First
Most investors instinctively jump to the consolidated results. With Grasim, that instinct works against you.
The market builds its estimates around the standalone performance, and for good reason. The standalone entity houses the businesses that analysts actively model quarter after quarter — and it is where the newer, capital-hungry ventures show up most visibly. The consolidated statement, by contrast, absorbs a very large subsidiary contribution, which can mask what is happening inside the parent.
So when brokerages publish a Grasim estimate, they are usually talking about the standalone line. That is why a standalone swing from loss to profit carries so much more signalling value than a percentage point of movement in the consolidated figure. It tells you whether the core operations of the parent entity are actually paying for themselves.
Keep that framing in mind as we walk through the numbers. The standalone story is the story.
Standalone Revenue: A 27% Year-on-Year Surge
Start with the topline.
Grasim posted standalone revenue from operations of ₹11,794 crore this quarter. A year ago, the same quarter delivered ₹9,223 crore. That works out to growth of roughly 27.9% — a genuinely strong expansion for a business of this size.
Growth of that magnitude does not come from price increases alone. It typically points to a combination of higher volumes, better realisations, and contribution from newer capacity coming online. When a company adds nearly ₹2,570 crore of incremental revenue in a single quarter versus the prior year, the operating base has clearly widened.
That said, one number rarely tells the whole story. You need the sequential comparison too.
Sequential Revenue: Flat, and That Matters
Compare this quarter against the immediately preceding one and the picture changes tone.
The previous quarter produced ₹11,774 crore. This quarter produced ₹11,794 crore. That is an increase of ₹20 crore — a rounding error on a base of nearly ₹12,000 crore. Sequentially, revenue was flat.
Flat is not automatically bad. Many businesses in this space carry seasonality, and a quarter that holds its ground after a strong preceding quarter is respectable. But it does temper the excitement generated by the 27% year-on-year headline.
Here is the practical takeaway: the year-on-year comparison shows how far the company has travelled; the sequential comparison shows whether momentum is still building. Right now, the first says a lot and the second says the business has plateaued at a higher level rather than continuing to climb.
Investors should track the next two quarters closely. If sequential revenue stays flat again, the year-on-year growth rate will start compressing automatically as the base catches up.
Revenue Versus Estimates: A Small Miss, Not a Red Flag
The market had modelled standalone revenue of approximately ₹12,200 crore for the quarter. Grasim delivered ₹11,794 crore.
That is a shortfall of roughly ₹406 crore, or about 3.3% below consensus.
How seriously should you treat a 3% miss? Honestly, not very. A miss of that size sits comfortably within the normal error band of quarterly forecasting. Analysts build estimates from channel checks, price data, and management guidance — none of which capture last-minute shifts in dispatch schedules, monsoon-related demand softness, or a delayed order.
A 3% revenue miss becomes a problem only when it repeats across quarters or when it comes attached to margin deterioration. Neither condition applies here. In fact, the exact opposite happened on the cost side — which brings us to the most important part of this result.
Expense Control: The Quiet Engine Behind the Beat
This is where the quarter was won.
Look at the standalone expense trajectory:
- Preceding quarter: approximately ₹11,250 crore
- Year-ago quarter: ₹9,523 crore
- Current quarter: ₹11,641 crore
Year-on-year, expenses rose about 22.2%, while revenue rose about 27.9%. That gap of nearly six percentage points is the entire story of this result compressed into one comparison. Revenue grew faster than costs — and that is the definition of operating leverage working in your favour.
Now put the sequential lens on it. Revenue was flat quarter-on-quarter. Under normal circumstances, flat revenue with rising input costs would crush the bottom line. Instead, management held expenses tight enough that the flat topline still produced a profit.
Management deserves credit here, particularly on the cement side of the business, where cost discipline appears to have driven a meaningful part of the improvement. Freight, power, fuel, and raw material costs make up the bulk of the cost structure in that segment, and squeezing them consistently is operationally hard work — not an accounting trick.
The Margin Math, Simplified
Run the arithmetic yourself:
- Revenue: ₹11,794 crore
- Expenses: ₹11,641 crore
- Operating gap: ₹153 crore
The reported net profit of ₹246 crore sits above that gap, which points to contributions from other income and the tax line. That is a normal structure for a company with substantial treasury and investment holdings. The important observation is that the operating gap itself turned positive after a stretch of quarters where it did not.
Standalone Profit: From ₹163 Crore Loss to ₹246 Crore Profit
Here is the number that moved sentiment.
- Preceding quarter: loss of ₹163 crore
- Year-ago quarter: loss of ₹118 crore
- Current quarter: profit of ₹246 crore
Read those three lines in sequence and the turnaround becomes obvious. On a year-on-year basis, the swing measures ₹364 crore. Sequentially, it measures ₹409 crore. Grasim moved from red to black on both comparison bases simultaneously — which does not happen by accident.
The Estimate Beat Is Even More Striking
The market was not expecting profitability at all this quarter.
Consensus had modelled a loss of roughly ₹45 crore. Analysts were not predicting disaster — a ₹45 crore loss on a ₹12,000 crore revenue base is close to breakeven — but they were predicting red ink.
Grasim delivered a ₹246 crore profit instead. That is a beat of approximately ₹291 crore against expectations.
When a company misses on revenue by 3% but beats on profit by that margin, the message is unambiguous: the cost structure improved faster than anyone modelled. For a business that has been absorbing heavy investment-phase expenses, that is exactly the inflection point long-term shareholders have been waiting to see.
EPS Turnaround: The Per-Share View
Earnings per share often gets skipped in quarterly commentary. It shouldn’t be — EPS is what actually accrues to you as a shareholder.
- Preceding quarter: –₹2.41
- Year-ago quarter: –₹1.74
- Current quarter: ₹3.64
The sequential swing works out to ₹6.05 per share. The year-on-year swing comes to ₹5.38 per share.
Those are meaningful moves. A company that was destroying ₹2.41 of value per share in the previous quarter generated ₹3.64 of earnings per share in this one. Sustain that run rate and the annualised standalone EPS looks completely different from what the trailing numbers suggest.
The caveat, as always: one quarter does not establish a run rate. Watch whether the next quarter confirms it.
Consolidated Numbers: The Bigger Picture
Now let us widen the lens to the consolidated statement, which folds in subsidiary performance.
Consolidated Revenue
- Preceding quarter: approximately ₹51,010 crore
- Year-ago quarter: approximately ₹41,180 crore
- Current quarter: ₹48,716 crore
Year-on-year, consolidated revenue expanded by roughly 18% — solid growth at that scale. Sequentially, however, revenue declined by about 4.5%.
This creates an interesting divergence worth noting. Standalone revenue held flat sequentially, while consolidated revenue slipped. That difference points to softness at the subsidiary level rather than in the parent’s own operations. If you are tracking this business, that divergence is worth monitoring in the next quarter’s release.
Consolidated Expenses
- Preceding quarter: ₹46,281 crore
- Year-ago quarter: ₹36,656 crore
- Current quarter: ₹43,851 crore
The same discipline visible at the standalone level shows up here. Sequentially, consolidated expenses dropped by roughly ₹2,430 crore — a decline of about 5.2%, which slightly outpaced the 4.5% revenue decline. In other words, costs fell faster than revenue did, protecting the profit line even as the topline softened.
Year-on-year, expenses rose approximately 19.6% against revenue growth of about 18%. That is broadly proportionate, though it does mean the year-on-year operating leverage at the consolidated level is less dramatic than what the standalone entity delivered.
The cost control achieved in the cement business appears to have flowed through to the consolidated statement as well — which makes sense, given how much of the group’s operating footprint that segment represents.
Consolidated Profit
- Preceding quarter: ₹3,684 crore
- Year-ago quarter: ₹770 crore
- Current quarter: ₹3,846 crore
Year-on-year, consolidated profit multiplied roughly five-fold. Sequentially, it rose about 4.4%.
Read that alongside the revenue trend and something important emerges: consolidated revenue fell sequentially, yet consolidated profit still rose. That combination only occurs when margins expand. It confirms that the cost story is real and not a one-quarter accounting artefact.
The consolidated operating gap — revenue minus expenses — works out to approximately ₹4,865 crore this quarter, against roughly ₹4,729 crore in the preceding quarter. Wider gap, smaller revenue base, better margin.
Putting It All Together: How Good Was This Quarter, Really?
Let me give you my honest read rather than a diplomatic one.
The strong points:
- The standalone swing to profitability is the headline achievement. Moving from a ₹163 crore loss to a ₹246 crore profit in a single quarter, against a market expecting continued losses, is the kind of surprise that resets expectations.
- Cost discipline is visible everywhere. Standalone expenses grew slower than revenue. Consolidated expenses fell faster than revenue. Both point to the same underlying management focus.
- Consolidated profit rose on both comparison bases. Year-on-year and quarter-on-quarter improvement together is a stronger signal than either alone.
- The EPS turnaround is substantial. A ₹6 per share sequential swing changes the arithmetic for anyone valuing the stock on earnings.
The soft points:
- Revenue missed consensus by about 3.3%. Small, but it is a miss.
- Standalone revenue was flat sequentially. Growth momentum paused.
- Consolidated revenue declined sequentially. Something at the subsidiary level softened, and that warrants a closer look at segment disclosures.
Net verdict: the numbers were good. The revenue shortfall is the kind of thing you accept when the profit line delivers a beat of this size. If forced to choose between a company that hits revenue estimates while losing money and one that misses revenue slightly while turning profitable, most long-term investors take the second every time.
What Actually Drove the Turnaround?
The reported numbers tell you what happened. Working out why requires reading the segment disclosures alongside the headline figures. Based on the pattern in the data, a few forces likely combined:
Cement realisations and cost control. The commentary around this quarter points repeatedly to expense management in the cement business. Cement economics hinge on a handful of controllable variables — power and fuel costs, freight and logistics, and capacity utilisation. Improvement in any two of those three can flip a segment’s contribution meaningfully within a couple of quarters.
Operating leverage on a larger base. With revenue nearly 28% higher year-on-year at the standalone level, fixed costs spread across a bigger denominator. That mechanically improves margins even without any operational heroics.
Maturing investment-phase costs. Businesses in a heavy build-out phase carry start-up expenses that depress reported profit long before the revenue arrives. As those ventures scale, the drag reduces. A swing from consistent losses to profit is often the first visible sign that this transition has begun.
Subsidiary contribution. The five-fold year-on-year jump in consolidated profit, against 18% revenue growth, indicates that subsidiary-level profitability improved dramatically — far more than the topline alone would suggest.
I want to be clear that the last three points are interpretations of the reported data, not disclosures from the company. Read the full segment breakdown in the official filing before drawing firm conclusions.
Key Numbers at a Glance
| Metric (Standalone) | Year-Ago Quarter | Preceding Quarter | Current Quarter |
|---|---|---|---|
| Revenue from operations | ₹9,223 cr | ₹11,774 cr | ₹11,794 cr |
| Total expenses | ₹9,523 cr | ~₹11,250 cr | ₹11,641 cr |
| Net profit / (loss) | (₹118 cr) | (₹163 cr) | ₹246 cr |
| EPS | (₹1.74) | (₹2.41) | ₹3.64 |
| Metric (Consolidated) | Year-Ago Quarter | Preceding Quarter | Current Quarter |
|---|---|---|---|
| Revenue from operations | ~₹41,180 cr | ~₹51,010 cr | ₹48,716 cr |
| Total expenses | ₹36,656 cr | ₹46,281 cr | ₹43,851 cr |
| Net profit | ₹770 cr | ₹3,684 cr | ₹3,846 cr |
| Estimate vs Actual (Standalone) | Street Estimate | Reported | Variance |
|---|---|---|---|
| Revenue | ~₹12,200 cr | ₹11,794 cr | –₹406 cr (miss) |
| Net profit | (₹45 cr) loss | ₹246 cr profit | +₹291 cr (beat) |
What to Watch in the Next Quarter
If you are tracking this stock, these are the specific things worth monitoring rather than the headline numbers everyone will quote:
1. Does sequential revenue growth resume? Two consecutive flat quarters would signal that the growth phase has matured. One flat quarter is noise; two is a trend.
2. Does the standalone profit hold? A single profitable quarter after a loss-making stretch can result from favourable timing. Two consecutive profitable quarters confirm a genuine structural shift.
3. What happened at the subsidiary level? Consolidated revenue fell sequentially while standalone held flat. Identify which subsidiary softened and whether the cause was temporary.
4. Do input costs stay contained? The entire profit story rests on expense discipline. Any sharp move in fuel, power, or freight costs would test how durable that discipline really is.
5. Cement demand and pricing trends. Given how much of the cost improvement traces back to this segment, sector-level pricing and dispatch data will preview the next quarter’s outcome well before the results arrive.
6. Capex and capital allocation commentary. How much more investment does the newer business absorb before it stops weighing on standalone profitability? Management commentary on the trajectory matters more than any single quarter’s numbers.
Risks Investors Should Not Ignore
Balanced analysis requires naming the downside honestly.
Commodity cost volatility. Cement and related businesses remain sensitive to fuel, power, and freight costs. A meaningful upward move in any of those would compress the margins that just improved.
Demand cyclicality. Construction and infrastructure demand follow economic and seasonal cycles. A slowdown in either would hit volumes directly.
Competitive pressure. The sectors Grasim operates in feature aggressive, well-capitalised competitors. Pricing power is never permanent, and in newer ventures it can take years to establish.
Execution risk in newer businesses. Scaling a new venture into profitability requires sustained investment, distribution build-out, and market share capture — and none of those follow a fixed timetable.
Single-quarter interpretation risk. This is the big one. It is genuinely tempting to extrapolate one strong quarter into a permanent trend. Resist that. Confirmation requires several quarters of consistency.
Frequently Asked Questions
Did Grasim beat or miss expectations this quarter? Both, in different places. Revenue came in about 3.3% below the estimate of roughly ₹12,200 crore. Profit dramatically beat expectations — the market expected a loss of around ₹45 crore and the company reported a profit of ₹246 crore instead.
Why did the standalone entity report a profit after previous losses? Cost control did the heavy lifting. Standalone revenue grew nearly 28% year-on-year while expenses rose about 22%, and management held expenses steady enough that even a flat sequential topline still produced a profit.
Why are standalone results discussed before consolidated results? Market estimates for Grasim are built primarily around the standalone entity, which houses the businesses analysts model most closely. The consolidated statement includes large subsidiary contributions that can obscure the parent’s own operating performance.
What was the EPS this quarter? Standalone EPS came in at ₹3.64, compared with –₹2.41 in the preceding quarter and –₹1.74 in the year-ago quarter.
Consolidated revenue fell sequentially — is that a concern? It is worth watching rather than worrying about. Consolidated revenue declined roughly 4.5% quarter-on-quarter, but consolidated profit still rose, because expenses fell faster than revenue. Margins expanded despite the smaller topline.
How much did consolidated profit grow year-on-year? Consolidated profit rose from ₹770 crore to ₹3,846 crore — roughly a five-fold increase.
Are these results enough to justify buying the stock? That depends entirely on your entry price, time horizon, risk appetite, and overall portfolio construction. One quarter of results is a single data point, not an investment thesis. Read the full filing and consult a registered financial adviser before acting.
The Bottom Line
Grasim delivered a quarter that will change how the market models this business over the next few reporting cycles.
Revenue slightly undershot expectations, and sequential growth paused — those are legitimate observations. But the profit story overwhelms them. A standalone entity that the street expected to report another loss instead posted a ₹246 crore profit. Consolidated profit rose year-on-year and quarter-on-quarter simultaneously, even as consolidated revenue dipped. Expenses came under control across the board.
The pattern running through every one of those data points is the same: costs grew slower than revenue, and margins expanded as a result. That is the foundation of durable earnings growth.
The open question is durability. One quarter establishes possibility, not proof. If the next two quarters confirm this trajectory — sequential revenue growth resuming, standalone profitability holding, cost discipline persisting — then this result marks a genuine inflection point rather than a favourable blip.
For now, the honest summary is straightforward: good numbers, a small revenue miss that hardly matters, and a profit beat that matters a great deal.
This article analyses publicly reported quarterly results for informational purposes only. It is not investment advice, and I am not a registered financial adviser. Figures for prior periods are presented as reported and rounded where appropriate; always verify against the company’s official filings with the exchanges. Consult a qualified financial professional before making any investment decision.