EaseMyTrip has released its Q1 numbers, and the results tell a story that most headlines will miss. Revenue moved higher. Losses appeared anyway. That contradiction sits at the centre of this quarter, and it deserves a closer look than a one-line summary can give.
If you follow travel stocks, online travel agency (OTA) earnings, or small-cap tourism plays on the Indian market, this quarter offers a useful lesson: top-line growth means very little when the cost line grows faster. Below, I break down every major number the company disclosed, explain what drove each one, and highlight the metrics that actually matter going forward.
All figures below appear in crore rupees unless stated otherwise, and they reflect the numbers as reported in the quarterly disclosure. Always cross-check against the company’s official filing on the exchanges before you act on anything.
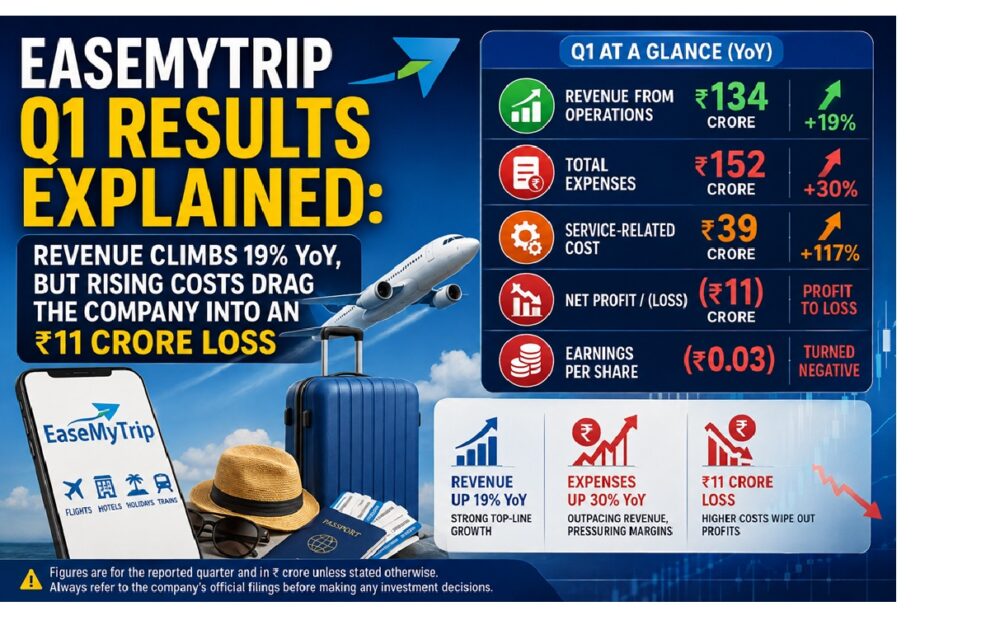
EaseMyTrip Q1 Results at a Glance
Here is the full quarter compressed into one view.
| Metric | Year-Ago Quarter | Previous Quarter | Current Quarter | YoY Change |
|---|---|---|---|---|
| Revenue from operations | ₹113 crore | ₹151 crore | ₹134 crore | +19% |
| Total expenses | ₹117 crore | ₹181 crore | ₹152 crore | +30% |
| Service-related cost | ₹18 crore | — | ₹39 crore | +117% |
| Net profit / (loss) | ₹0.40 crore profit | (₹15 crore) | (₹11 crore) | Profit to loss |
| Operating profit / (loss) | Marginally positive | Negative | (₹11 crore) | Profit to loss |
| Earnings per share | ~₹0.00 | (₹0.04) | (₹0.03) | Turned negative |
Three takeaways jump out immediately:
- Revenue grew nearly 19% year-on-year — a genuinely healthy number for a travel intermediary.
- Expenses grew almost 30% year-on-year — considerably faster than revenue, which is where the quarter went wrong.
- The company slipped from a small profit into an ₹11 crore loss on a year-on-year basis, despite the stronger top line.
Revenue Performance: Strong Year-on-Year, Softer Sequentially
Start with the line that looks best.
Revenue from operations came in at ₹134 crore, up from ₹113 crore in the same quarter last year. That works out to roughly 19% year-on-year growth, which signals that booking volumes, ticketing activity, and overall travel demand held up well through the period.
For an asset-light travel platform, revenue growth of that size usually reflects a mix of higher gross booking value, better take rates, or expansion into adjacent verticals such as hotels, holiday packages, and non-air travel products. The company clearly moved more business through its platform this quarter than it did a year ago.
Now the less flattering comparison.
Measured against the immediately preceding quarter, revenue fell from ₹151 crore to ₹134 crore — a sequential decline of roughly 11% to 12%. On paper, that reads like a slowdown.
In practice, it mostly reads like a calendar.
Why the Sequential Dip Deserves Less Attention Than You Think
Travel is one of the most seasonal businesses in India, and EaseMyTrip sits directly in that seasonality. Booking patterns swing hard across the year based on school holidays, festival calendars, wedding season, monsoon disruption, peak summer travel, and year-end vacation demand.
That means quarter-on-quarter comparisons in this sector routinely mislead. A weaker sequential quarter can follow an exceptionally strong one without indicating any deterioration in the underlying business. Similarly, a strong sequential quarter can simply reflect a favourable travel calendar rather than genuine market-share gains.
For a seasonal business like this, year-on-year comparison remains the honest yardstick. You compare the same season against the same season, which strips out the calendar effect and leaves you with the actual trend.
Apply that lens and the picture improves: revenue grew 19% against the comparable quarter last year. The business is expanding. The demand environment is working in the company’s favour.
The problem lies elsewhere.
Expenses: The Number That Defined This Quarter
Total expenses climbed to ₹152 crore, up from ₹117 crore in the year-ago quarter. That is roughly a 30% year-on-year increase.
Set the two growth rates side by side and the issue becomes obvious:
- Revenue growth: ~19%
- Expense growth: ~30%
When your cost base grows at nearly double-digit speed above your revenue base, profitability collapses regardless of how good the top line looks. That is exactly what happened here. Expenses at ₹152 crore exceeded revenue of ₹134 crore outright, which means the core business consumed more than it generated during the quarter.
Sequentially, expenses did come down — from ₹181 crore in the previous quarter to ₹152 crore now. But that decline tracks the revenue decline, so it offers limited comfort. Costs fell because activity fell, not because the company found meaningful efficiency.
The ₹18 Crore to ₹39 Crore Jump That Changed Everything
Buried inside the expense breakdown sits the single most striking number in the entire result.
Service-related costs more than doubled — from ₹18 crore to ₹39 crore year-on-year. That represents an increase of roughly 117%, at a time when revenue grew by less than a fifth.
This is the line item to watch in coming quarters. A cost head that expands at six times the rate of revenue does not just dent one quarter’s profitability; it changes the shape of the business model if it persists.
Several explanations can sit behind a jump of this kind at an online travel platform:
- Higher customer acquisition spend — discounts, cashbacks, promotional fares, and marketing pushed to defend or expand market share in a fiercely competitive OTA market.
- Increased payment gateway, technology, and transaction-processing costs tied to higher booking volumes.
- Expansion into lower-margin or service-intensive verticals, where the cost of servicing each booking runs materially higher than in core air ticketing.
- Investment in scale ahead of revenue — building capacity, teams, or infrastructure for growth that has not yet arrived.
The company’s own disclosures and management commentary would confirm which of these applies. What the numbers alone establish is that the cost of doing business rose dramatically faster than the business itself.
For anyone tracking this stock, the key question for the next result is simple: does this cost line normalise, or does it become the new baseline? The answer determines whether this quarter marks a one-off investment phase or a structural margin problem.
From Profit to Loss: The Bottom Line
Now to the number that will drive the market reaction.
In the year-ago quarter, the company reported a profit of approximately ₹40 lakh — thin, but positive. This quarter, it reported a net loss of ₹11 crore.
That is a clear year-on-year deterioration: the company moved from black to red despite growing revenue by 19%.
Two important nuances sit alongside that headline.
First, the loss narrowed sequentially. The previous quarter carried a loss of ₹15 crore. This quarter’s loss stands at ₹11 crore. So on a quarter-on-quarter basis, the damage reduced by roughly ₹4 crore.
Second, and more importantly, the sequential improvement does not offset the year-on-year reversal. A smaller loss is still a loss, and the comparison that matters for a seasonal business — same quarter, previous year — shows the company giving up profitability entirely.
There is also a technical detail worth flagging. Revenue of ₹134 crore against expenses of ₹152 crore implies a gap of around ₹18 crore, yet the reported loss came in at ₹11 crore. That difference typically reflects other income, treasury or interest earnings, tax adjustments, or exceptional items sitting between the operating line and the final bottom line. The detailed filing will specify the exact bridge, and investors should read it rather than assume.
Operating Performance: The Core Business Turned Negative
Net profit figures can flatter or punish a company depending on one-off items. Operating performance strips that noise away, which makes it the more revealing measure.
Here the message stays consistent. The company posted a small operating profit in the year-ago quarter and an operating loss of roughly ₹11 crore this quarter.
That matters because it confirms the deterioration sits in the core business, not in accounting adjustments or unusual items. The platform generated more revenue and still failed to cover the cost of generating it.
For an asset-light, commission-driven model — where the theoretical appeal lies in high operating leverage and scalable margins — an operating loss on rising revenue is the least comfortable outcome available. It suggests the leverage is running in reverse: incremental revenue is arriving with more than incremental cost attached.
Debt, Finance Costs, and the Pressure on the Bottom Line
The elevated borrowings on the company’s books add another layer of pressure. Interest obligations sit below the operating line and consume whatever operating profit the business generates before it reaches shareholders.
When a company operates near breakeven at the operating level, finance costs alone can determine whether the quarter ends in profit or loss. That dynamic appears to be at work here, and it amplifies every operating stumble.
The practical implication for investors: watch the debt trajectory as closely as the revenue trajectory. A company that grows revenue while deleveraging tells a very different story from one that grows revenue while its interest burden climbs. The balance sheet in the full filing will show which pattern applies.
Earnings Per Share: A Small Number With a Clear Signal
EPS came in at negative ₹0.03 for the quarter, compared with roughly ₹0.00 in the year-ago quarter and negative ₹0.04 in the previous quarter.
The absolute numbers look tiny because of the company’s large equity base, but the direction carries the signal:
- Year-on-year: EPS moved from approximately flat to clearly negative.
- Sequentially: the loss per share narrowed marginally, from 4 paise to 3 paise.
Per-share losses of this scale do not threaten solvency. They do, however, make traditional valuation on an earnings basis impossible, which pushes the market to value the stock on revenue multiples, growth expectations, and eventual margin recovery instead. That kind of valuation framework tends to be far more volatile — sentiment moves it more than fundamentals do.
The Share Price Reaction: A Rally That Ran Ahead of the Numbers
Here is where the market narrative becomes interesting.
Ahead of the results announcement, the stock rallied roughly 4% to 5% during the session. That kind of pre-result move usually reflects positioning by traders anticipating a strong quarter — a bet that the numbers would deliver a positive surprise.
The numbers did not deliver that surprise. Revenue growth arrived as hoped, but the profitability picture disappointed, with the company reporting a loss where it had earned a small profit a year earlier.
This creates a familiar setup: expectations ran ahead of delivery. Markets typically resolve that gap in the following sessions, as the pre-result optimism meets the post-result reality. How the stock behaves next depends heavily on whether investors read the cost spike as temporary investment or as permanent margin compression.
Nobody can predict that reaction with confidence, and short-term price movements in small and mid-cap travel stocks respond to far more than a single quarterly print. Volumes, sentiment, sector flows, and broader market direction all play their part.
What This Quarter Actually Tells Us About the Business
Strip away the noise and three conclusions hold up.
1. Demand is not the problem
Revenue grew 19% year-on-year. Customers are booking. The travel market is healthy. Whatever ails this company, weak demand is not on the list.
2. Unit economics are the problem
Expenses grew 30% while revenue grew 19%. Service costs more than doubled. The company is buying growth at a price that currently exceeds what the growth returns. Until that ratio flips, revenue expansion will keep producing losses rather than profits.
3. The competitive environment is squeezing margins
India’s online travel market is brutally competitive. Established platforms, airline direct-booking channels, aggressive discounting, and new entrants all compete for the same traveller. In that environment, holding market share often requires spending that eats directly into margins. The doubling of service costs is entirely consistent with a company defending its position in a price-competitive market.
Key Metrics to Track in the Next Quarter
If you follow this stock or the sector, these are the specific items worth watching when the next results arrive:
Service cost as a percentage of revenue. This quarter it consumed roughly 29% of revenue, against about 16% a year ago. If that ratio falls back, the margin story recovers. If it holds or rises, the business model needs rethinking.
Total expenses versus revenue growth. The gap between 19% and 30% is the entire problem. Watch whether it narrows.
Operating profit or loss. The cleanest measure of whether the core business works. A return to operating profit would be the single most encouraging signal available.
Gross booking value and take rate. Revenue alone does not reveal whether the company is winning volume or improving economics. Booking value paired with realisation tells you which.
Debt levels and finance costs. Lower borrowings and lower interest expense would meaningfully improve the path back to net profitability.
Management commentary on the cost spike. If leadership frames the increase as planned investment with a defined payback period, that carries very different weight from an unexplained cost overrun.
Risks Investors Should Weigh
Any assessment of this quarter should account for the following:
- Margin compression may persist. If competitive intensity forces continued discounting, profitability could stay elusive for several quarters.
- Seasonality cuts both ways. A favourable travel season can flatter results just as easily as a weak one can depress them. Judge trends across a full year, not a single print.
- Loss-making companies carry valuation risk. Without earnings, valuation depends on expectations, and expectations reset quickly.
- Sector-wide sensitivity. Fuel prices, airline capacity, regulatory changes, geopolitical disruption, and macroeconomic pressure on discretionary spending all affect travel demand and lie outside the company’s control.
- Execution risk in new verticals. Diversification beyond core air ticketing can lift revenue while pressuring margins during the ramp-up phase.
Frequently Asked Questions
What was EaseMyTrip’s revenue in Q1? The company reported revenue from operations of ₹134 crore, up from ₹113 crore in the same quarter of the previous year — growth of roughly 19% year-on-year. Sequentially, revenue declined from ₹151 crore, a fall of about 11% to 12%.
Did EaseMyTrip report a profit or loss this quarter? The company reported a net loss of approximately ₹11 crore. In the year-ago quarter, it had posted a small profit of around ₹40 lakh. The loss narrowed compared with the previous quarter’s ₹15 crore loss.
Why did the company post a loss despite higher revenue? Expenses grew far faster than revenue. Total expenses rose around 30% year-on-year to ₹152 crore, while revenue grew about 19% to ₹134 crore. Service-related costs alone more than doubled, from ₹18 crore to ₹39 crore.
What was the EPS for the quarter? Earnings per share stood at negative ₹0.03, compared with approximately ₹0.00 in the year-ago quarter and negative ₹0.04 in the preceding quarter.
Why did revenue fall compared with the previous quarter? Travel is a highly seasonal business. Booking volumes shift substantially across quarters depending on holiday calendars, festival timing, and weather. For this reason, year-on-year comparison provides a more reliable read on performance than quarter-on-quarter comparison.
Is the sequential improvement in losses a positive sign? Partially. The loss narrowed from ₹15 crore to ₹11 crore sequentially, which shows some improvement. However, the year-on-year comparison — moving from profit to loss — remains the more meaningful measure for a seasonal business, and that comparison is negative.
What should investors watch next? The relationship between revenue growth and expense growth. Specifically, whether service costs normalise as a share of revenue, whether the company returns to operating profit, and whether debt and finance costs trend lower.
The Bottom Line
This quarter delivered a genuinely good revenue print and a genuinely poor profitability print, and the second one matters more.
Revenue of ₹134 crore, up 19% year-on-year, proves demand exists and the platform is capturing it. That is the foundation of any recovery story. But expenses of ₹152 crore, up 30% year-on-year, exceeded revenue outright and pushed the company from a small profit into an ₹11 crore loss. The doubling of service costs from ₹18 crore to ₹39 crore stands out as the single line item most responsible for the reversal.
The sequential narrowing of losses offers a small positive. The year-on-year slide from profit to loss offers a larger negative. Between them, the honest verdict is that the company is growing its business without yet growing its profitability — and until that changes, stronger revenue will keep translating into weaker earnings.
Whether this quarter represents a deliberate investment phase or a structural margin problem will become clear over the next two to three results. Investors who want to understand this stock should read the full filing, listen to management’s explanation of the cost increase, and track the expense-to-revenue ratio quarter by quarter.
That ratio, more than any headline, will determine where this company goes next.
This article is intended for informational and educational purposes only. It does not constitute investment advice, a recommendation to buy or sell any security, or a solicitation of any kind. All figures reflect reported quarterly disclosures and should be verified against the company’s official filings with the stock exchanges. I am not a registered investment adviser. Markets carry risk, and past performance offers no guarantee of future results. Consult a SEBI-registered financial adviser before making any investment decision.