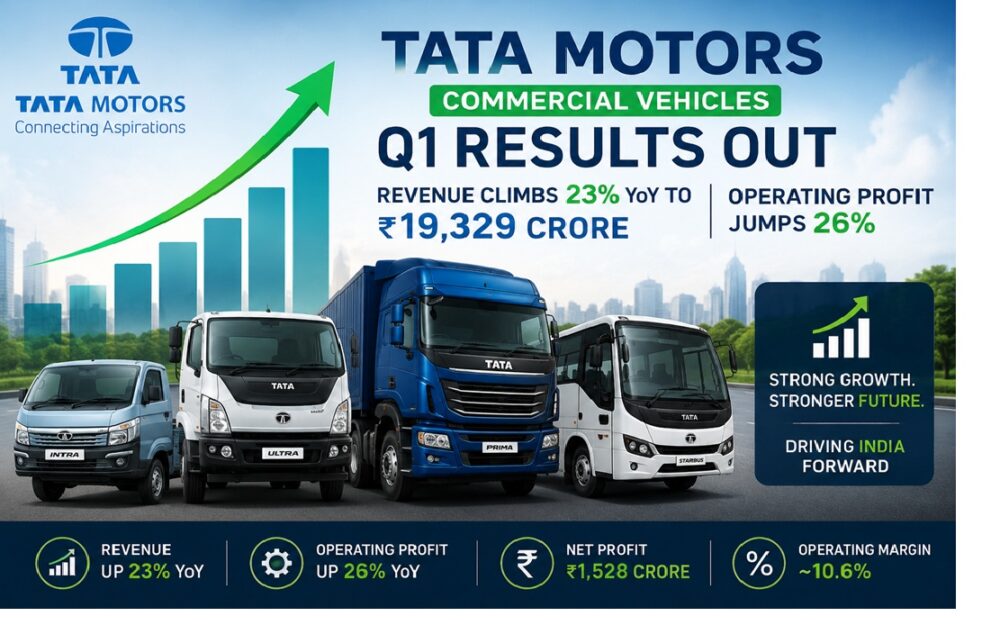
Tata Motors’ commercial vehicle arm has put its first-quarter numbers on the table, and the scorecard reads better than most brokerage desks expected. Revenue grew roughly 23% year-on-year, operating profit expanded close to 26%, and net profit beat consensus estimates by a comfortable margin — even though a higher tax outgo and a one-time exceptional charge kept the bottom line from running as hard as the operating line did.
Below is a complete, plain-English breakdown of the quarter: what the company reported, how it stacks up against the year-ago period and the previous quarter, where the margins moved, and what long-term investors should actually pay attention to.
Tata Motors CV Q1 Results at a Glance
Before diving into the line items, here is the quarter in a single view. All figures are standalone numbers, because market estimates for this business were built on the standalone basis rather than the consolidated one.
| Metric | Q1 (Current) | Q1 (Year Ago) | YoY Change | Previous Quarter | QoQ Change |
|---|---|---|---|---|---|
| Revenue from operations | ₹19,329 crore | ₹15,682 crore | +23.3% | ~₹24,452 crore | -21% |
| Total expenses | ₹17,668 crore | ₹14,292 crore | +23.6% | ₹21,720 crore | -18.7% |
| Operating profit (EBITDA) | ₹2,057 crore | ₹1,635 crore | +25.8% | — | — |
| Net profit (PAT) | ₹1,528 crore | ₹1,411 crore | +8.3% | ~₹2,406 crore | -36.5% |
| Net profit margin | 7.90% | 8.99% | -109 bps | 9.83% | -193 bps |
| Operating margin | ~10.6% | ~10.4% | +21 bps | — | — |
| EPS | ₹4.15 | ₹3.83 | +8.4% | ₹6.53 | -36.4% |
Versus street estimates:
- Revenue expected: ~₹19,600 crore → Reported ₹19,329 crore → In line
- Net profit expected: ~₹1,300 crore → Reported ₹1,528 crore → Beat by roughly 17%
The short version: revenue landed exactly where analysts modelled it, profit landed meaningfully above, and the operating engine performed better than the headline PAT growth suggests.
Why the Standalone Numbers Matter Most Here
Whenever a large listed company reports, two sets of numbers hit the screen — standalone and consolidated. Investors often glance at whichever one appears first, and that habit creates unnecessary confusion.
For this quarter, the standalone set carries more analytical weight for one simple reason: brokerage estimates were framed on the standalone business. Comparing a consolidated actual against a standalone estimate produces a meaningless “beat” or “miss.” Analysts modelled standalone revenue near ₹19,600 crore and standalone profit near ₹1,300 crore, so the like-for-like comparison has to stay on that basis.
This matters more than usual for the commercial vehicle business because the CV entity now reports as a distinct listed company following Tata Motors’ restructuring. Investors tracking it are no longer looking through a blended lens where passenger vehicles, electric vehicles and the overseas luxury business smooth out the cyclicality. What you see now is the trucks-and-buses engine on its own — with all the operating leverage and all the cyclical exposure that comes with it.
Revenue Deep Dive: A Strong Year-on-Year Print
Revenue from operations came in at ₹19,329 crore, up from ₹15,682 crore in the same quarter last year. That is an increase of ₹3,647 crore, or roughly 23% year-on-year.
For a commercial vehicle business — where volumes track freight demand, infrastructure spending, replacement cycles and financing availability — a growth rate in the low-to-mid twenties is a genuinely healthy print. This is not a category that compounds smoothly. It moves in waves tied to the broader economic cycle, and a 23% top-line expansion signals that the current wave is still carrying the business forward.
Sequentially, however, the picture inverts. Against the previous quarter’s revenue of roughly ₹24,452 crore, this quarter’s ₹19,329 crore represents a decline of about 21%.
That drop looks alarming until you understand why it happens.
The Sequential Decline Is Seasonal, Not Structural
The March quarter is almost always the strongest three-month stretch of the year for Indian commercial vehicle makers. Fleet operators time purchases to close out the financial year, dealers push to clear inventory before the year rolls over, and corporate buyers finalise capital expenditure before the books shut. Volumes get pulled forward into that window.
The June quarter then starts from a naturally lower base. Add the onset of the monsoon — which slows construction activity, mining movement and rural freight — and a sequential dip becomes the default outcome, not a red flag.
This is precisely why analysts covering the auto sector judge these companies year-on-year rather than quarter-on-quarter. Comparing June to March in a seasonal business tells you about the calendar, not about the company. Comparing June to the previous June strips out that seasonality and isolates genuine operational progress.
By that standard, the quarter looks solid.
Revenue Versus Estimates: Right on the Mark
Consensus modelled revenue at roughly ₹19,600 crore. The company delivered ₹19,329 crore — a shortfall of about 1.4%.
In practical terms, that qualifies as in line. A variance of one to two percent against an estimate built weeks in advance falls well within normal forecasting noise. It becomes a talking point only when a company misses by high single digits or more, or when the miss traces back to a specific structural problem such as collapsing volumes or aggressive discounting.
Neither condition applies here. Revenue arrived essentially where the street expected it to arrive.
Cost Structure: Expenses Tracked Revenue Almost Exactly
Total expenses rose to ₹17,668 crore from ₹14,292 crore a year earlier — an increase of about 23.6%.
Compare that against revenue growth of 23.3% and the picture becomes clear: costs expanded in near-perfect proportion to the business. There is no hidden cost blowout, no runaway raw material inflation, no sudden spike in operating overheads.
Sequentially, expenses fell to ₹17,668 crore from ₹21,720 crore, an 18.7% decline against a 21% revenue decline. Costs came down slightly less than revenue did, which is exactly what you would expect in a quarter with lower volumes — fixed costs do not shrink at the same pace as sales.
The gap between revenue and expenses widened in absolute terms year-on-year, from ₹1,390 crore to ₹1,661 crore. That is the operating engine doing its job.
For a manufacturer, this cost discipline matters enormously. Commercial vehicle production consumes steel, aluminium, rubber, electronic components and freight — all inputs subject to volatile pricing. A quarter where expenses grow in lockstep with revenue rather than outpacing it suggests the company either managed input costs well, passed increases through to customers effectively, or both.
Operating Profit: The Strongest Line in the Entire Report
Here is where the quarter genuinely impresses.
Operating profit climbed to ₹2,057 crore from ₹1,635 crore in the year-ago quarter — a jump of ₹422 crore, or roughly 26%.
That growth rate outpaces revenue growth of 23%. When operating profit grows faster than revenue, it means the business is generating positive operating leverage — each additional rupee of sales is producing more than a proportional rupee of profit at the operating level. For a capital-intensive manufacturer, that is one of the healthiest signals available.
Operating margin expanded from approximately 10.4% to 10.6%, an improvement of around 21 basis points. Modest in isolation, but improvement in the right direction while the business scaled by nearly a quarter is a meaningful achievement.
This line deserves more attention than it typically receives, because operating profit reflects the actual health of the core business. It sits above interest costs, above tax, above one-time items — all of which can distort the final number for reasons unrelated to how well the company sold trucks and buses during the quarter.
On that measure, the business performed strongly.
Net Profit: A Beat, With Two Clear Drags
Net profit came in at ₹1,528 crore, up from ₹1,411 crore a year earlier — an increase of about 8.3%.
Set that 8% next to the 26% operating profit growth and an obvious question emerges: why did the bottom line grow at less than a third of the operating rate?
Two factors explain the gap.
Drag One: The Tax Outgo Roughly Doubled
The company’s tax expense approximately doubled year-on-year. The prior-year quarter carried a comparatively low tax charge, which flattered that period’s net profit and created an unusually demanding base for comparison.
Tax movements of this kind rarely reflect anything about business quality. They arise from the exhaustion of accumulated losses, changes in tax regime elections, deferred tax adjustments, or the timing of specific provisions. What matters analytically is that a normalised tax rate this year against a depressed rate last year mechanically compresses reported profit growth — regardless of how well the underlying operations performed.
Drag Two: An Exceptional Item of Roughly ₹100 Crore
The company also absorbed a one-time loss of approximately ₹100 crore under exceptional items.
By definition, exceptional items sit outside normal business activity. They typically cover asset impairments, restructuring provisions, one-off legal settlements, or write-downs on discontinued operations. They hit reported profit in the quarter they occur and then disappear from future comparisons.
Strip out that ₹100 crore charge and adjusted profit lands closer to ₹1,628 crore — pushing underlying growth into the mid-teens rather than single digits.
Net Profit Versus Estimates: A Clear Beat
Consensus expected profit of roughly ₹1,300 crore. The company delivered ₹1,528 crore — a beat of about 17.5%.
The context sharpens the significance. Many analysts had modelled a year-on-year decline in profit for this quarter, factoring in the normalised tax rate and expected margin pressure. Instead, the company grew profit, absorbed a ₹100 crore exceptional charge, paid double the tax, and still cleared the estimate by a wide margin.
That is a materially better outcome than the market had priced in.
Margin Analysis: Read the Right Margin
Margins generated the most confusing headlines from this report, so it is worth separating the two measures carefully.
Net profit margin (PAT margin):
- Year-ago quarter: 8.99%
- Previous quarter: 9.83%
- Current quarter: 7.90%
Net margin contracted by roughly 109 basis points year-on-year and 193 basis points sequentially. Read in isolation, that looks like deterioration.
Operating margin (EBITDA margin):
- Year-ago quarter: ~10.4%
- Current quarter: ~10.6%
Operating margin expanded.
Both statements are accurate, and the contradiction resolves cleanly. The compression in net margin originates entirely below the operating line — from the higher tax charge and the exceptional item. It does not originate from pricing pressure, discounting, or input cost inflation, all of which would have shown up in the operating margin.
This distinction matters because the two margins carry very different predictive weight. Operating margin tells you whether the company can sell its products profitably. Net margin tells you what survived after financing, tax and one-time events. For assessing business quality quarter to quarter, operating margin is the more reliable signal — particularly when the net margin decline traces to items that will not repeat.
An investor who reads only the 7.90% figure walks away with the wrong conclusion about this quarter.
Earnings Per Share
EPS came in at ₹4.15, up from ₹3.83 in the year-ago quarter — growth of roughly 8.4%, tracking net profit almost exactly and confirming that no meaningful share count change distorted the number.
Sequentially, EPS declined from ₹6.53, mirroring the seasonal revenue and profit pattern already discussed rather than indicating any fresh problem.
For investors tracking valuation multiples, the annualised run rate implied by ₹4.15 is a useful anchor — though it is worth remembering that a single June quarter is a weak basis for annualising a seasonal business. The March quarter typically carries a disproportionate share of full-year earnings, so straight-line extrapolation from Q1 understates the full-year picture.
The Complete Estimates Scorecard
Pulling everything together against what the market expected:
| Line Item | Street Estimate | Reported | Verdict |
|---|---|---|---|
| Revenue | ~₹19,600 crore | ₹19,329 crore | In line |
| Net profit | ~₹1,300 crore | ₹1,528 crore | Beat |
| Operating profit | — | ₹2,057 crore (+26%) | Strong |
| Net margin | — | 7.90% (-109 bps YoY) | Softer, explainable |
| EPS | — | ₹4.15 (+8.4%) | In line with PAT |
Overall, this reads as a healthy quarter. Revenue met expectations, the operating engine outperformed, and profit exceeded a bar that many analysts had set below the prior year. The only genuine soft spot — net margin — traces to a tax normalisation and a one-time charge rather than to any weakness in the core business.
What This Means for the Commercial Vehicle Cycle
Quarterly results are data points; the cycle is the story. A few broader observations are worth drawing from these numbers.
Demand appears to be holding. A 23% year-on-year revenue expansion in commercial vehicles does not happen when freight demand is contracting or fleet operators are deferring purchases. The top line suggests that infrastructure activity, replacement demand and freight movement all remained supportive through the quarter.
Pricing power looks intact. Expenses grew almost exactly in line with revenue while operating margin still expanded slightly. That combination indicates the company protected realisations rather than buying volume through discounts. In a competitive category, that is a genuine positive.
Operating leverage is working. Operating profit growing faster than revenue is the clearest evidence that the business converts incremental scale efficiently. If demand momentum sustains, that leverage should continue compounding.
The tax base has normalised. The tax comparison will remain unfavourable for as long as the company laps quarters that carried an unusually low tax charge. Investors should mentally adjust for this when assessing headline profit growth over the next few reporting periods.
Key Risks to Monitor
No quarter should be read without the counterweight. Several factors deserve attention going forward.
Cyclical exposure. Commercial vehicles are among the most cyclical categories in the economy. Demand tracks GDP growth, infrastructure spending, freight rates and credit availability. A slowdown in any of these translates quickly into volumes. Strong growth off a favourable base does not guarantee that the base stays favourable.
Input cost volatility. Steel and other commodity prices move on global supply-demand dynamics far outside the company’s control. Operating margin held up this quarter, but a sharp commodity spike would test that resilience.
Financing conditions. Most commercial vehicles are purchased on credit. Rising interest rates or tighter lending standards reduce affordability and delay purchase decisions — a transmission channel that can affect volumes quickly.
Competitive intensity. The Indian CV market features well-capitalised competitors across every segment. Aggressive pricing by any large player would pressure margins across the industry.
Regulatory and transition costs. Emission standards, safety mandates and the gradual shift toward alternative powertrains all require sustained capital investment. These are necessary expenditures, but they consume cash flow and can weigh on returns during transition periods.
Base effects ahead. A quarter that grew 23% raises the bar for the corresponding quarter next year. Investors should calibrate expectations for growth rates to normalise as the base rises.
Frequently Asked Questions
What was Tata Motors Commercial Vehicles’ revenue in Q1? Revenue from operations reached ₹19,329 crore, up from ₹15,682 crore in the year-ago quarter — growth of roughly 23% year-on-year. Against the previous quarter’s approximately ₹24,452 crore, revenue declined about 21% sequentially, reflecting normal seasonality.
Did the company beat or miss estimates? Revenue landed in line, arriving at ₹19,329 crore against an expectation of roughly ₹19,600 crore. Net profit beat clearly, coming in at ₹1,528 crore against an estimate near ₹1,300 crore — a beat of about 17.5%.
What was the net profit? Net profit reached ₹1,528 crore, up approximately 8.3% from ₹1,411 crore a year earlier.
Why did net profit grow only 8% when operating profit grew 26%? Two below-the-line factors created the gap. The tax outgo roughly doubled year-on-year because the prior-year quarter carried an unusually low tax charge. Separately, the company absorbed an exceptional item of about ₹100 crore. Adjusting for the exceptional charge alone would lift underlying profit growth into the mid-teens.
What happened to margins? Net profit margin narrowed to 7.90% from 8.99% a year ago and 9.83% in the previous quarter. Operating margin, however, improved slightly to roughly 10.6% from 10.4%. The compression occurred below the operating line, driven by tax and the exceptional item — not by weaker pricing or higher input costs.
What was the EPS? EPS came in at ₹4.15, up from ₹3.83 in the year-ago quarter, against ₹6.53 in the previous quarter.
Why did revenue fall sequentially? The March quarter is seasonally the strongest period for Indian commercial vehicle makers as fleet buyers and dealers complete year-end purchases. The June quarter starts from a naturally lower base and typically faces monsoon-related slowdowns in construction and freight activity. A sequential decline is the normal pattern, not a warning sign.
Should investors focus on year-on-year or quarter-on-quarter numbers? Year-on-year. Auto and commercial vehicle businesses carry pronounced seasonality, and sequential comparisons measure the calendar more than the company. Comparing the same quarter across years neutralises that seasonality and isolates genuine operational progress.
What are exceptional items and why do they matter? Exceptional items are one-time gains or losses outside normal business operations — asset impairments, restructuring provisions, legal settlements or write-downs. They hit reported profit in the period they occur but do not recur, so analysts typically strip them out when assessing underlying performance.
What is the single most important takeaway from this quarter? Operating profit grew 26% against revenue growth of 23%, with operating margin expanding. That combination indicates the core business is scaling efficiently and retaining pricing power. The softer net profit growth reflects tax normalisation and a one-time charge rather than any deterioration in operations.
The Bottom Line
Judged against what the market expected, this quarter delivered more positives than negatives.
Revenue met estimates and grew 23% year-on-year. Expenses tracked revenue almost exactly, showing disciplined cost management. Operating profit surged 26% with margin expansion, confirming that the core business is converting scale into profit efficiently. Net profit beat consensus by roughly 17.5% despite a doubled tax charge and a ₹100 crore exceptional item — two headwinds that alone explain the entire gap between 26% operating growth and 8% net growth.
The sequential declines across revenue, profit and EPS reflect the seasonal rhythm of the Indian commercial vehicle market rather than any operational setback. The net margin contraction reflects accounting and tax realities rather than pricing pressure.
For investors tracking the commercial vehicle cycle, this print suggests demand momentum remained intact through the quarter and the business retained its ability to grow profitably. The natural follow-up questions concern durability: whether volume momentum sustains as base effects harden, whether input costs stay contained, and whether the operating leverage visible this quarter carries into the seasonally stronger periods ahead.
Those answers arrive in the next set of numbers. This quarter, at least, gave the bulls more to work with than the bears.
All financial figures in this article are drawn from the quarterly results as reported and discussed in the source material. Comparative figures for the preceding quarter are derived from the reported margin, EPS and expense data. Investors should verify all numbers against the company’s official filings and exchange disclosures before making any decision. This article is intended for informational purposes only and does not constitute investment advice or a recommendation to buy or sell any security.