


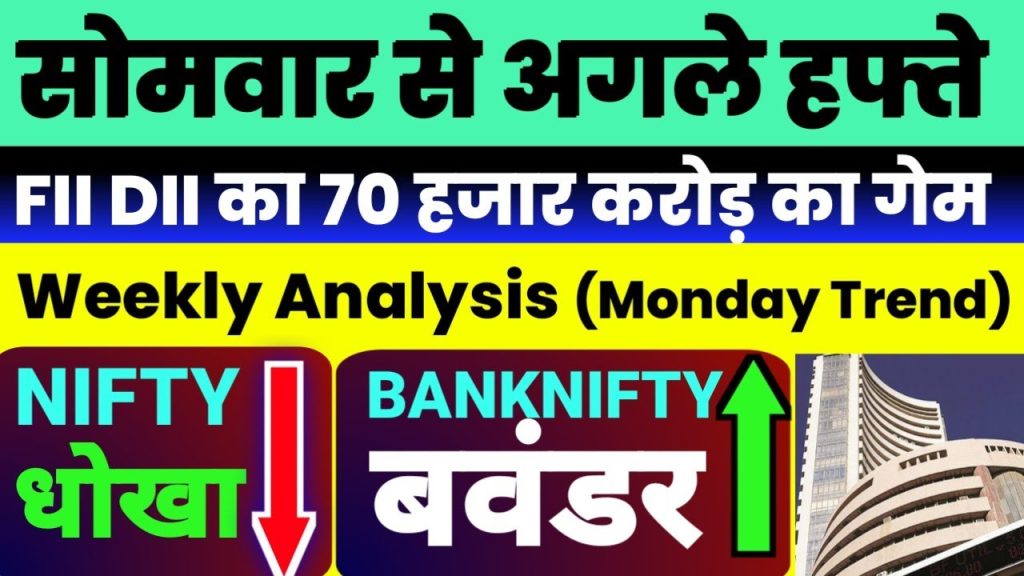
The stock market is a dynamic arena, constantly influenced by global events, economic data, and investor behavior. This comprehensive analysis dives into the upcoming week’s market trends, focusing on Nifty, Bank Nifty, and critical factors such as Foreign Institutional Investors (FII) and Domestic Institutional Investors (DII) activities, options data, and global economic cues. By examining daily and weekly trends, support and resistance levels, and key news events, this article equips investors with actionable insights to navigate the market confidently.
Understanding Market Sentiment: FII and DII Data Insights
Market sentiment often hinges on the actions of institutional investors, particularly FIIs and DIIs. Their buying and selling patterns provide valuable clues about potential market directions.
FII Activity: A Medium Bearish Outlook
FIIs have adopted a medium bearish stance on index futures, with a notable influence from expiry data. Specifically, their positions reflect:
- Nifty: Medium bearish sentiment, indicating caution among foreign investors.
- Bank Nifty: Mildly bearish, suggesting a less aggressive downward bias.
- Midcap Nifty: A mix of mild bearish and bullish signals, reflecting indecision.
In the May series, FIIs purchased approximately ₹11,700 crore worth of securities, signaling selective buying. However, their overall approach remains cautious, particularly in index futures, where they anticipate limited upside in the near term.
DII Activity: Strong Buying Momentum
In contrast, DIIs have demonstrated robust buying, injecting around ₹67,000 crore into the market during the same period. This aggressive purchasing—nearly seven times that of FIIs—indicates strong domestic confidence. On the last trading day (Friday), DIIs bought ₹9,000 crore worth of securities, countering FIIs’ ₹6,000 crore in sales. This dynamic suggests DIIs are driving a momentum shift, particularly at current market levels.
Combined Impact: A Net Positive Inflow
Together, FIIs and DIIs contributed approximately ₹80,000 crore in net buying during the May series. This influx underscores a bullish undercurrent, with DIIs playing a pivotal role in sustaining market stability. However, the divergence between FII caution and DII aggression warrants close monitoring, as it could signal potential volatility.
Options Market Analysis: Decoding Volatility and Trader Behavior
The options market provides critical insights into trader expectations and potential price movements. By analyzing call and put options data, we can gauge market sentiment across different participant groups.
FIIs in Options: Chasing Volatility
FIIs have adopted a balanced approach in the options market, with activity on both call and put options. This suggests they are positioning for volatility rather than a clear directional move. Key observations include:
- Index Futures: Medium bearish, as FIIs expect limited upside.
- Index Options: A mix of medium bullish and bearish positions, indicating neutrality.
- Call Options: Mildly bullish, reflecting selective optimism.
- Put Options: Medium bullish-bearish, suggesting hedging against downside risks.
FIIs have refrained from aggressive call selling, instead focusing on buying puts, which reinforces their cautious outlook.
Professional Traders: Indecisive Stance
Professional traders exhibit indecision at current levels. Their positions in index options show:
- Call Options: Mildly bullish, indicating some optimism for an upward move.
- Put Options: Medium bullish-bearish, reflecting uncertainty.
- Overall Sentiment: Indecisive, as traders await clearer signals from market trends.
This indecision suggests professionals are closely monitoring key levels, particularly around Nifty and Bank Nifty’s current ranges.
Retail Traders: Medium Bullish Outlook
Retail traders display a medium bullish stance in index futures, anticipating a significant upward momentum. In the options market, they remain neutral, avoiding aggressive bets. Notably, retail traders have engaged in option selling, shorting both calls and puts. This strategy has created strong bearish signals in calls and strong bullish signals in puts, indicating a balanced but optimistic outlook. Retailers’ heavier buying of puts suggests confidence in a potential upward move, albeit with caution.
Key Economic Triggers: GDP Data and Global Influences
Economic data and global developments significantly influence market trends. Two major events stand out for the upcoming week: India’s GDP data and global policy shifts.
GDP Data: A Short-Term Positive, Long-Term Caution
India’s recent GDP data has sparked market reactions. The short-term outlook is positive, driven by strong economic momentum. However, long-term projections have been slightly downgraded, urging investors to remain cautious. The market’s reaction to the GDP data was evident in the sharp uptick in Bank Nifty towards the close of the last trading session, reflecting preemptive buying based on expectations.
Global Market Dynamics: Morgan Stanley’s Perspective
Morgan Stanley’s recent report highlights a cautious outlook for global markets, driven by uncertainties in the U.S. economy and rising bond yields. Key points include:
- U.S. Economic Concerns: Fears of economic slowdown and volatile bond yields could divert capital from equities to safer assets.
- India’s Positive Outlook: Morgan Stanley rates India as a “standout overweight,” signaling confidence in its long-term growth potential. This upgrade positions India favorably compared to other global markets, which may face headwinds.
Trump’s Tariff Announcement: Steel Sector Impact
A significant global development is the U.S. announcement to increase steel tariffs from 25% to 50%, effective June 4, 2025. This policy, aimed primarily at China, will also affect India and Vietnam. The tariff hike could impact India’s steel sector, requiring investors to monitor companies in this space closely. Additionally, the U.S.’s warm welcome to Japan’s Nippon Steel for a $14 billion investment suggests selective exemptions, which could further complicate global trade dynamics.
Nifty Technical Analysis: Key Levels and Trends
Technical analysis provides a roadmap for anticipating market movements. By examining daily and weekly charts, we can identify critical support and resistance levels for Nifty.
Daily Timeframe: Support and Resistance Levels
Nifty’s daily chart reveals a well-respected support line around 24,700, with a secondary support at 24,500. These levels are crucial for maintaining bullish control. Key observations include:
- Current Range: Nifty is struggling to sustain above 25,000, indicating resistance at higher levels.
- Friday’s Closing: The close above 24,700 is significant, as it reinforces the primary support level.
- Market Structure: Bulls are absorbing every dip, maintaining control as long as Nifty remains above 24,500. A sustained move above 25,000 could signal stronger bullish momentum.
If Nifty falls below 24,500, bears could gain control, potentially triggering a shift in market structure. Conversely, a breakout above 25,000 could trap sellers, fueling a bullish rally.
Weekly Timeframe: Bullish Engulfing Pattern
On the weekly chart, Nifty has followed a bullish structure since breaking out above 23,000, delivering a 1,700-point rally. Recent weeks show:
- Bullish Engulfing Candle: Nifty remains within the range of a bullish engulfing candle formed three weeks ago, indicating sustained bullish momentum.
- Profit-Taking Phase: After a strong bullish move, the market entered a consolidation phase, with two weeks of trading within the engulfing candle’s range.
- Key Levels: The 24,500–25,000 range is critical. A break below 24,500 could empower bears, while a move above 25,000 could trigger short covering, trapping sellers.
The weekly chart suggests a 50-50 chance for both bulls and bears, with 250 points of potential movement in either direction. Investors should remain vigilant, as news-driven volatility could sway the market.
Bank Nifty Technical Analysis: Momentum and Structure
Bank Nifty has exhibited significant strength, driven by a robust rally and a structural shift. Let’s explore its technical setup.
Weekly Timeframe: A Strong Uptrend
Bank Nifty’s weekly chart shows a clear uptrend, with a failed head-and-shoulders pattern paving the way for bullish momentum. Key points include:
- Structural Shift: After falling below 50,000, Bank Nifty retested this level and broke out, establishing a new uptrend.
- Current Position: The index is 1,000 points above the critical 54,800 support, reinforcing bullish control.
- Resistance Zone: The 56,000–56,100 range acts as a strong resistance, where selling pressure has previously emerged.
A breakout above 56,250 could ignite short covering, driving Bank Nifty higher. However, a drop below 55,600 could signal bearish control, particularly if the 54,800 support fails.
Daily Timeframe: Momentum and Caution
On the daily chart, Bank Nifty has shown resilience, holding above key support levels. Notable observations include:
- Recent Rejection: A rejection at 56,000 led to a 2,000–3,000-point correction, followed by consolidation.
- Key Levels: The 55,600–56,000 range is critical. A sustained move above 56,250 could confirm bullish strength, while a break