


State Bank of India (SBI) delivered robust Q1 FY2026 results with a 12.48% year-over-year net profit growth to ₹19,160 crore, significantly exceeding Street estimates of ₹17,095 crore. This stellar performance underscores India’s largest public sector bank’s resilience and strategic execution amid a dynamic banking landscape. The bank’s impressive financial metrics, competitive positioning, and growth trajectory make it a compelling case study for fundamental analysis.

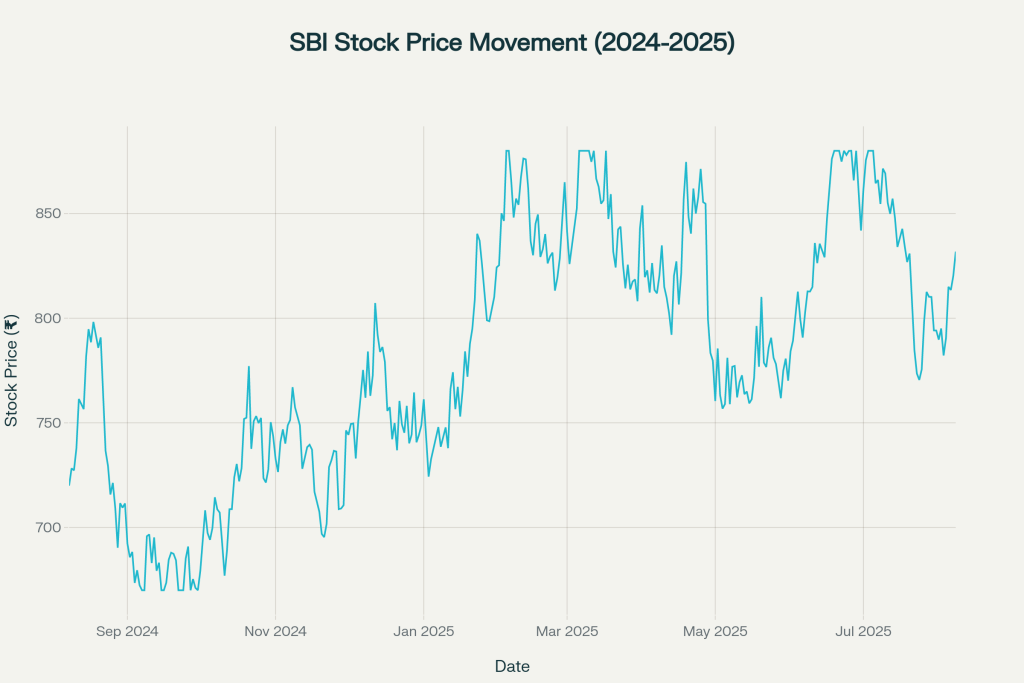
SBI stock price movement over the past year showing volatility and recent performance
Financial Statements Analysis
Revenue Growth and Profitability Trends
SBI’s financial performance in Q1 FY2026 demonstrates strong operational momentum across key metrics. Total income reached ₹1,66,992 crore, while the bank maintained disciplined cost management with operating expenses at ₹59,496 crore. The operating profit surged 15% year-over-year to ₹30,544 crore, reflecting improved operational efficiency and business mix optimization.
Net Interest Income (NII) remained largely flat at ₹41,072 crore compared to ₹41,125 crore in the previous year, indicating margin pressure but stable core earnings capacity. However, this represents a 4% sequential decline from Q4 FY2025, highlighting the challenging interest rate environment and competitive deposit market.
The bank’s Net Interest Margin (NIM) compressed to 3.02% from 3.15% in the previous quarter, primarily due to higher funding costs and the pass-through effect of recent rate cuts. Chairman CS Setty indicated a “U-shaped” NIM trajectory, expecting recovery to 3.15% by Q4 FY2026.
Earnings Per Share and Profitability Metrics
Earnings per share (EPS) improved to ₹21.47 in Q1 FY2026 from ₹19.09 in the corresponding quarter last year, representing a 12.5% year-over-year growth. This improvement reflects both higher absolute profits and disciplined share capital management.
The bank’s Return on Assets (ROA) stood at 1.14% as of Q1 FY2026, maintaining healthy asset utilization efficiency. Return on Equity (ROE) reached 16.0%, positioning SBI favorably among public sector banks and demonstrating effective capital deployment.
Gross profit margins remained robust at 86.93%, while net profit margins improved to 18.64%, indicating strong pricing power and operational leverage. These metrics compare favorably with industry benchmarks and highlight SBI’s ability to generate sustainable returns.
Balance Sheet Strength and Asset Quality
Total assets increased 8.6% year-over-year to ₹73.14 lakh crore as of March 2025, reflecting consistent balance sheet expansion. Total deposits grew 11.66% to ₹54.73 lakh crore, with the CASA (Current Account Savings Account) ratio at 39.36%.
Gross advances rose 11% to ₹42.5 lakh crore, with domestic retail loans growing 12.6% to ₹15.4 lakh crore and home loans expanding 15% to ₹8.5 lakh crore. The credit-to-deposit ratio improved to 78.1%, indicating efficient fund deployment.
Asset quality showed remarkable improvement with Gross NPA ratio declining to 1.83% from 2.21% year-over-year, while Net NPA ratio dropped to 0.47% from 0.57%. The Provisioning Coverage Ratio stood at 74.49%, providing adequate buffer against potential losses.
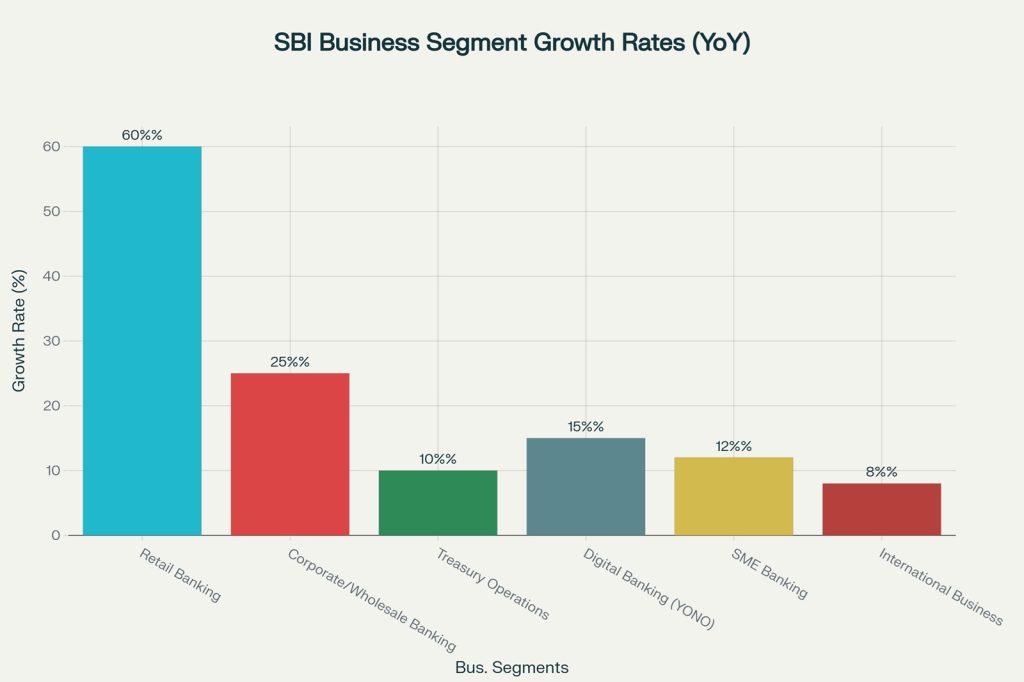
SBI’s business segment performance showing year-over-year growth rates across key divisions
Cash Flow Analysis and Liquidity Position
SBI’s cash flow from operations remained positive, supported by strong deposit growth and controlled provisioning. The bank’s liquidity position is robust with Cash Reserve Ratio (CRR) compliance at 4.5% and Statutory Liquidity Ratio (SLR) at 18% as mandated by RBI.
Capital Adequacy Ratio (CAR) of 14.63% provides comfortable cushion above regulatory requirements, enabling future growth without immediate capital infusion needs. The bank’s Tier 1 capital ratio remains well above minimum thresholds, ensuring regulatory compliance and growth capacity.
Valuation Metrics
Price-to-Earnings and Market Multiples
SBI trades at a P/E ratio of 9.58, representing attractive valuation compared to private sector peers. This multiple is significantly lower than HDFC Bank’s 18.2 and ICICI Bank’s 15.4, suggesting potential undervaluation or market skepticism about public sector banks.
| Bank | Market Cap (₹ Cr) | P/E Ratio | P/B Ratio | ROA (%) | ROE (%) | NPA Ratio (%) | Deposit Growth (%) | Advance Growth (%) |
| SBI | 743000 | 9.58 | 1.53 | 1.14 | 16 | 1.83 | 12 | 11 |
| HDFC Bank | 1200000 | 18.2 | 2.8 | 2.1 | 18.5 | 1.26 | 8 | 16 |
| ICICI Bank | 850000 | 15.4 | 2.1 | 1.8 | 16.8 | 3.15 | 10 | 15 |
| Axis Bank | 340000 | 12.8 | 1.8 | 1.2 | 14.2 | 1.98 | 14 | 18 |
| Bank of Baroda | 85000 | 6.8 | 0.9 | 0.8 | 12.1 | 2.45 | 9 | 8 |
| Punjab National Bank | 65000 | 5.2 | 0.7 | 0.6 | 8.5 | 4.12 | 7 | 5 |
Price-to-Book (P/B) ratio of 1.53 compares favorably with the sector average, indicating reasonable valuation relative to book value. The P/B multiple has compressed from historical averages, potentially offering value-oriented investors an attractive entry point.
Market capitalization of ₹7.43 lakh crore positions SBI as India’s third-largest bank by market value, despite being the largest by assets and deposits. This valuation gap with private peers reflects ongoing market perception differences between public and private sector banks.
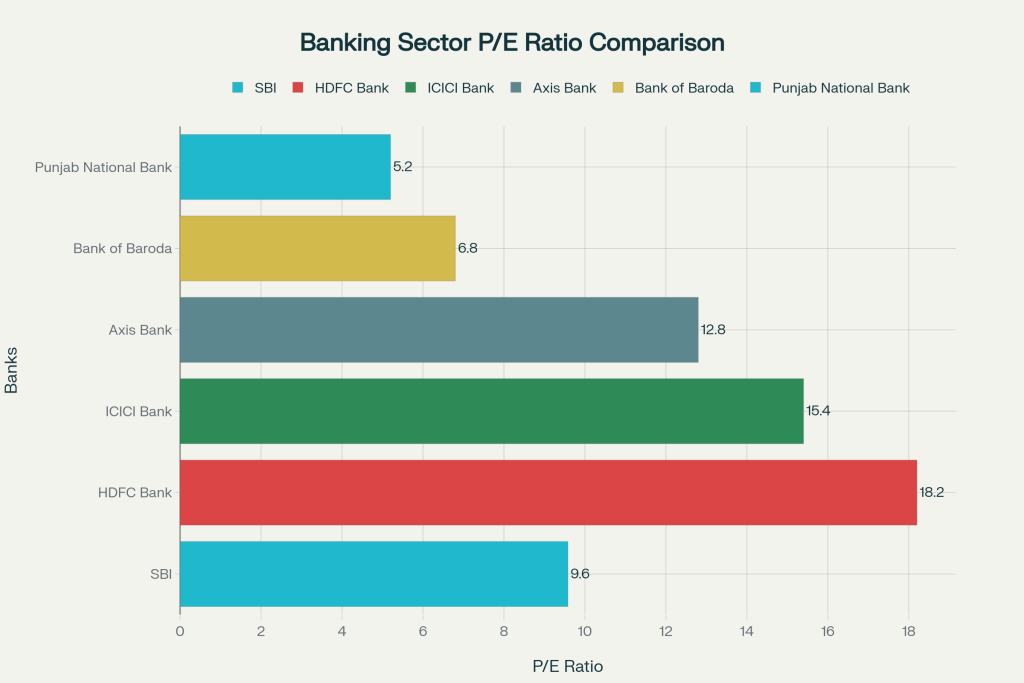
P/E ratio comparison between SBI and major competitor banks in the Indian banking sector
Enterprise Value and Dividend Analysis
Dividend yield of 1.97% provides reasonable income return for investors, with the bank maintaining consistent dividend payments. The dividend payout ratio of approximately 18-20% ensures sustainable distributions while retaining capital for growth.
Enterprise Value-to-EBITDA calculations for banks require specialized approaches given the financial services business model. SBI’s operational efficiency metrics, including the cost-to-income ratio of 51.64%, suggest improving operational leverage.
Growth Potential & Competitive Positioning
Industry Dynamics and Market Share
SBI maintains dominant market position with 22.54% deposit market share and 19.36% advance market share as of March 2025. This market leadership provides significant competitive advantages including pricing power, distribution scale, and customer acquisition efficiency.
The Indian banking sector is experiencing moderate credit growth of 10.8-11.5% projected for FY2025-26. SBI’s loan growth of 11-12% aligns with industry trends while maintaining asset quality discipline.
Digital transformation initiatives through YONO platform show remarkable progress with 74 million registered users and over 10 million daily logins. This digital adoption positions SBI competitively against fintech disruption while expanding customer engagement.
Innovation and Digital Banking Leadership
YONO platform has facilitated over ₹3.2 lakh crore in loan disbursements since inception, representing 65% of savings account transactions. This digital-first approach addresses evolving customer preferences and improves operational efficiency.
Technology investments and process automation have contributed to improved cost-to-income ratios and customer experience metrics. SBI’s digital banking initiatives position it favorably against both traditional and new-age competitors.
Rural and semi-urban market penetration through 22,542 branches and 63,580 ATMs provides unmatched distribution reach. This extensive network creates barriers to entry and enables comprehensive financial inclusion programs.
Management Excellence and Strategic Vision
Chairman CS Setty’s strategic leadership emphasizes balanced growth, digital transformation, and risk management. The management team’s experience in navigating economic cycles and regulatory changes provides institutional stability.
Strategic initiatives including international expansion, subsidiary performance, and partnership developments demonstrate comprehensive growth planning. The bank’s ability to adapt to changing market conditions while maintaining profitability showcases management competence.
Risk Analysis
Market and Macroeconomic Risks
Interest rate sensitivity remains a key risk factor, with NIM compression evident during rate cycle changes. Rising funding costs and competitive deposit pricing pressures could impact profitability margins.
Economic slowdown risks could affect credit demand and asset quality, particularly in retail and SME segments. However, SBI’s diversified portfolio and conservative underwriting standards provide resilience.
Regulatory changes from RBI regarding capital requirements, lending norms, and digital banking regulations could impact operations and profitability. The bank’s compliance track record and regulatory relationships mitigate these risks.
Operational and Competitive Pressures
Competition from private banks and fintech companies intensifies pressure on market share and margins. Private banks’ superior operational efficiency and customer service create competitive challenges.
Technology disruption and cybersecurity threats require continuous investment and risk management. SBI’s substantial technology spending and security infrastructure address these challenges proactively.
Talent retention and organizational culture in a government-owned entity face challenges from private sector competition. However, job security and social purpose attract quality professionals.
Asset Quality and Credit Risks
Slippage rates of 0.75% indicate manageable credit risk, though monitoring remains essential as economic conditions evolve. The bank’s credit cost of 0.47% suggests effective risk management practices.
Sectoral concentration risks in agriculture, SME, and infrastructure require continuous monitoring. However, diversified lending portfolio and conservative provisioning provide adequate protection.
Corporate lending challenges from market-based financing alternatives could impact growth and yields. SBI’s relationship banking approach and comprehensive service offerings help retain corporate clients.
Recent Catalysts and Market Developments
Q1 FY2026 Earnings Performance
Better-than-expected Q1 results with 12.48% profit growth exceeded analyst estimates significantly. This performance demonstrates SBI’s ability to navigate challenging operating conditions while maintaining growth momentum.
Stable asset quality metrics with declining NPA ratios provide confidence in credit risk management capabilities. The trend towards improved asset quality supports sustainable profitability growth.
Digital banking milestones including YONO customer additions and transaction volumes indicate successful transformation initiatives. These achievements position SBI advantageously in the evolving banking landscape.
Strategic Initiatives and Partnerships
QIP issuance of ₹25,000 crore demonstrates proactive capital planning and regulatory compliance. This capital raising provides growth flexibility and strengthens balance sheet resilience.
International expansion with presence in 29 countries and 233 offices globally diversifies revenue sources and serves NRI customers effectively. This geographic diversification provides growth opportunities and risk mitigation.
Subsidiary performance across insurance, mutual funds, and card services contributes materially to overall profitability. These diversified revenue streams reduce dependence on traditional banking margins.
Regulatory Environment and Policy Support
Government ownership of 57.43% provides implicit support and stability during economic uncertainties. This backing enhances depositor confidence and funding access.
Priority sector lending mandates align with SBI’s rural focus and social banking objectives. These requirements, while constraining, also provide stable lending opportunities with government support.
Digital India initiatives and financial inclusion programs create favorable operating environment for SBI’s expansion strategies. Government policy support enhances growth prospects in underserved markets.
Investment Outlook & Recommendations
Bullish Investment Case
Attractive valuation metrics with P/E ratio of 9.58 and P/B ratio of 1.53 provide compelling value proposition compared to private sector peers. Market skepticism toward public sector banks creates opportunity for contrarian investors.
Improving operational efficiency with cost-to-income ratio declining to 51.64% and ROE maintaining above 15% demonstrates effective management execution. These trends support sustainable earnings growth.
Digital transformation success through YONO platform and technology investments positions SBI competitively for future banking evolution. The bank’s ability to adapt to changing customer preferences enhances long-term prospects.
Market leadership position with dominant deposit and advance market shares provides competitive moats and pricing power. This scale advantage enables investment in technology and expansion while maintaining profitability.
Risk Considerations and Bearish Factors
Margin pressure from competitive deposit market could constrain NIM recovery and profitability growth. Rising funding costs and rate cycle uncertainties present near-term challenges.
Intense competition from private banks and fintech requires continuous investment in technology and service improvements. Market share defense may pressure margins and returns.
Government ownership constraints could limit strategic flexibility and operational agility compared to private sector competitors. Bureaucratic processes and policy changes may impact decision-making speed.
Economic sensitivity to GDP growth, interest rates, and credit cycles affects lending demand and asset quality. Macroeconomic volatility presents ongoing operational risks.
Investment Horizon and Strategic Outlook
Short-term perspective (1-2 years) focuses on earnings stability, NIM recovery, and digital banking progress. Current valuation provides defensive characteristics with potential for multiple expansion.
Medium-term outlook (3-5 years) emphasizes market share retention, operational efficiency improvements, and technology transformation benefits. Consistent dividend payments provide income component.
Long-term investment case (5+ years) centers on India’s banking sector growth, financial inclusion expansion, and SBI’s market leadership sustainability. Demographic trends and economic development support structural growth.
Conclusion
State Bank of India presents a compelling fundamental investment opportunity combining defensive characteristics with growth potential. The bank’s dominant market position, improving asset quality, and successful digital transformation provide competitive advantages in India’s evolving banking landscape.
Q1 FY2026 results demonstrating 12.48% profit growth and beating analyst estimates showcase management’s ability to navigate challenging conditions effectively. Attractive valuation metrics with P/E of 9.58 offer value-oriented investors an opportunity to participate in India’s largest bank’s growth story.
Key investment considerations include monitoring NIM recovery, competitive positioning against private banks, and digital banking adoption rates. The bank’s strong balance sheet, government backing, and comprehensive service offerings provide downside protection while enabling participation in India’s financial sector growth.
Risk-adjusted return potential appears favorable given current valuation levels and improving operational metrics. Investors seeking exposure to India’s banking sector growth with dividend income and defensive characteristics should consider SBI as a core holding in their financial services allocation.