


The year was 1989. Japan’s Nikkei 225 hit an all-time high of 38,915 – the most expensive stock market in the world. Tokyo’s Imperial Palace grounds were theoretically worth more than the entire real estate of California. Taxi drivers gave stock tips. Housewives day-traded. Then, in less than three years, the market lost 80% of its value. Thirty-five years later, the Nikkei has only recently crossed its 1989 peak again.
This is the story every Indian investor fears today: “Are we the next Japan?”
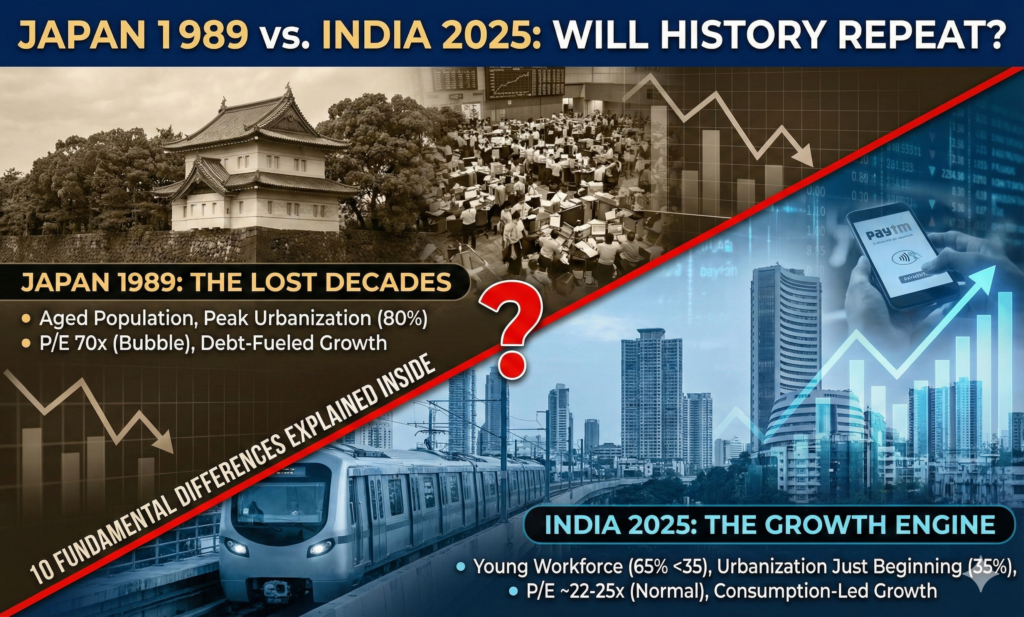
In this in-depth guide, we break down exactly what caused the Japan stock market crash of 1989-1990, why it led to three “Lost Decades,” the hidden success stories that happened even during the darkest years, and most importantly – the 10 fundamental differences that make today’s India structurally different from 1989 Japan.
The Hidden Hand Behind the Crash: The 1985 Plaza Accord
Most people think Japan’s bubble burst because of “greed” or “speculation.” The real trigger was geopolitical.
On September 22, 1985, finance ministers from the G5 nations (USA, Japan, West Germany, France, and UK) met secretly at the Plaza Hotel in New York. America was running a massive trade deficit – Japan’s exports were crushing U.S. industries. The solution? Force the Japanese Yen to appreciate dramatically.
Within 18 months, the Yen doubled in value against the dollar – from ¥240 to ¥120. Japanese exports became 100% more expensive overnight. To offset the damage, the Bank of Japan slashed interest rates from 5% to 2.5% and flooded the system with cheap money.
Result? An uncontrollable asset bubble in stocks and real estate.
Anatomy of the Biggest Financial Bubble in History
- Nikkei 225 rose 6x from 1980 to 1989
- Price-to-Earnings ratios hit 70x (global average today: ~20x)
- Land in Tokyo’s Ginza district reached $1 million per square meter
- Corporate Japan borrowed heavily to play the stock market (Zaitech)
- Banks lent unlimited money against inflated land collateral
When the bubble finally burst in 1990, the fallout was catastrophic:
- Nikkei lost 80% from peak to trough
- Real estate values collapsed 70-80%
- Banks drowned in non-performing loans
- Deflation set in for decades
- Lifetime employment system cracked
- Japan entered the “Lost Decades”
Will India Face Japan-Style Crash in 2025-2030? 10 Fundamental Differences
Here’s the truth most fear-mongers ignore – India 2025 is structurally the opposite of Japan 1989.
1. Demographics: Japan Was Aging Rapidly, India Is Young and Growing Japan’s working-age population peaked in 1995 and has been shrinking ever since. India has the world’s largest youth population – 65% under age 35 – with peak demographics lasting until 2045-2050.
2. Urbanization Story Just Beginning Japan was already 80% urbanized by 1980. India is only ~35% urbanized. The next 25 years will see 300-400 million people migrate to cities – creating organic demand for housing, infrastructure, healthcare, and consumer goods.
3. Valuations Still Within Global Norms Nifty 50 P/E today: 22-25x vs Japan’s 70x in 1989. Corporate earnings growth in India has been 15-18% CAGR over the past decade – real profits backing stock prices.
4. Domestic Consumption-Led Growth 60-65% of India’s GDP comes from domestic private consumption (vs Japan’s export-heavy model). Even global shocks can’t derail internal demand.
5. Controlled Banking System RBI’s tight regulation prevented the reckless real-estate lending that destroyed Japanese banks. Gross NPA ratio today: ~3% vs Japan’s 15-20% post-crash.
6. Proactive Policy Response Japan delayed tightening until too late. RBI has shown willingness to raise rates aggressively (2022 cycle) and implement structural reforms (IBC, GST, PLI schemes).
7. Currency Flexibility Rupee is market-determined with managed float. No risk of forced 100% appreciation like the Yen post-Plaza Accord.
8. Entrepreneurial Energy vs Peak Complacency Japan believed it had become “Number One.” India knows it’s still a developing nation – hunger and aspiration levels are completely different.
9. Global Investor Base Foreign investors own ~20% of Indian markets with strong domestic institutional depth (mutual funds, insurance, pensions). Japan was dominated by cross-shareholdings and retail speculation.
10. Technology & Digital Advantage India skipped landlines and went straight to mobile. We’re doing the same with digital payments, UPI, ONDC, and fintech – creating entirely new growth engines Japan never had.
Even in Japan’s Lost Decades – Millionaires Were Quietly Made
The biggest myth? “Everyone lost money in Japan for 35 years.”
Truth: While the Nikkei delivered only ~2.8% annualized returns from 1990-2025, smart investors achieved 8-15% CAGR through:
- Global diversification (US S&P 500 delivered 10%+ CAGR)
- Value investing in undervalued Japanese small-caps
- Dividend aristocrats (Toyota, NTT continued paying 3-5% yields)
- Emerging market exposure (early investors in Infosys made 500x)
- Yen carry trade profits
- Contrarian real estate buys in secondary cities
One disciplined SIP investor who started in 1995 with monthly ₹5,000 (adjusted) turned it into crores by staying diversified and patient.
Warren Buffett’s Japan Strategy 2020-2025: Free Money Masterclass
Since 2020, Berkshire Hathaway has built a $20+ billion stake in Japanese trading houses (Itochu, Marubeni, Mitsubishi, Mitsui, Sumitomo).
His genius move?
He financed the purchases by issuing Yen-denominated bonds at near-zero interest rates while receiving 5-8% dividend yields – creating permanent positive carry. The dividends pay off the debt, and he owns the equity for “free.”
Even after 35 years of stagnation, Buffett found a way to generate high teens IRR in Japan – proof that opportunities exist even in “dead” markets.
How to Build a Japan-Proof, Crash-Resistant Portfolio for Indian Investors
Here’s the exact framework used by investors who survived – and thrived – through Japan’s crash:
Core Allocation (50-60%): India Equity
- Large-cap index funds (Nifty 50/Next 50)
- Flexi-cap/multi-cap active funds
- Mid & small-cap only if you have 10+ year horizon
Global Diversification (20-30%)
- 15-20% US (S&P 500/Nasdaq-100)
- 5-10% Developed markets (Europe, Japan, Australia)
- 5% Emerging markets ex-India
Defensive Assets (15-20%)
- 7-10% Gold (digital/ETF/sovereign bonds)
- 5-10% Debt (short-duration + long-duration mix)
Alternatives (5-10%)
- REITs/InvITs for real estate exposure
- Small allocation to global thematic funds
Rebalancing Rules
- Reduce exposure when P/E > 30x
- Increase when P/E < 18x
- Never let single-country exposure exceed 70%
- Maintain 6-12 months cash during extreme valuations
This structure delivered 12-15% CAGR historically with 40% lower volatility than pure India equity.
Final Verdict: India Is NOT the Next Japan
Japan’s crash was caused by a lethal cocktail of forced currency appreciation, reckless monetary policy, demographic decline, and overvalued assets.
India today has none of these structural weaknesses.
Yes, corrections will come. Valuations may get expensive. But a permanent lost decade? Extremely unlikely.
The real risk isn’t India becoming Japan.
The real risk is panic-selling your SIPs because of YouTube fear-mongering.
Stay invested. Stay diversified. Stay disciplined.
Because as Japan proved – even in the worst market crashes in history, the patient, educated, and globally diversified investor always wins.
Your SIPs are safe. Your financial goals are achievable. And India’s best decades are still ahead.
Keep investing. The Japan ghost has been exorcised.