


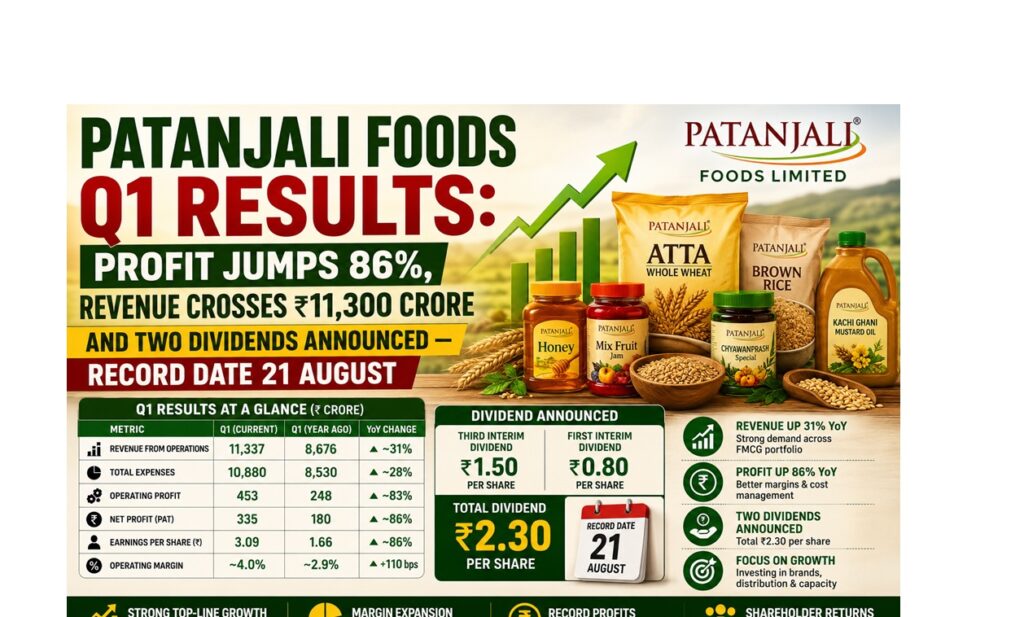
Patanjali Foods has put its first-quarter numbers on the table, and the headline reads well on both sides of the profit and loss statement. Revenue climbed past ₹11,300 crore, net profit nearly doubled compared with the same quarter a year earlier, and the board sweetened the announcement with not one but two interim dividends landing on the same record date.
For a company that spent much of the recent past trading uncomfortably close to its 52-week low, this is the kind of quarter that forces the market to take a second look. Below, I break down every line of the result — revenue, expenses, operating profit, net profit, earnings per share and the dividend mechanics — and explain what each number actually signals about the business underneath.
Patanjali Foods Q1 Results at a Glance
Before diving into the detail, here is the quarter in one view. All figures are in ₹ crore unless stated otherwise, and all comparisons are drawn against both the year-ago quarter (YoY) and the immediately preceding quarter (QoQ).
| Metric | Q1 (Current) | Q1 (Year Ago) | Previous Quarter | YoY Change |
|---|---|---|---|---|
| Revenue from Operations | 11,337 | 8,676 | 11,155 | Up ~31% |
| Total Expenses | 10,880 | 8,530 | 10,807 | Up ~28% |
| Operating Profit | 453 | 248 | 404 | Up ~83% |
| Net Profit (PAT) | 335 | 180 | 523 | Up ~86% |
| Earnings Per Share (₹) | 3.09 | 1.66 | 4.82 | Up ~86% |
| Operating Margin | ~4.0% | ~2.9% | ~3.6% | +110 bps |
Two things stand out immediately. First, profit grew far faster than revenue — always the signal investors care about most, because it means the company kept more of every rupee it earned. Second, the sequential dip in net profit is not what it appears to be at first glance, and I explain exactly why further down.
The Dividend Announcement: ₹2.30 Per Share Across Two Payouts
Let’s start where most retail shareholders will start — the cash coming back to them.
The company announced two separate interim dividends in the same board meeting, which is unusual enough to cause confusion, so it’s worth laying out clearly:
- Third interim dividend: ₹1.50 per share
- First interim dividend: ₹0.80 per share
- Total: ₹2.30 per share
Both dividends share a single record date of 21 August.
Why Two Dividends at Once?
The dual announcement is a housekeeping matter rather than a strategic signal. One payout closes out the dividend cycle belonging to the previous financial year — hence “third interim” — while the second opens the cycle for the current financial year as the “first interim” dividend. Companies frequently bundle a trailing declaration with a fresh one when board meeting calendars and payout schedules don’t line up neatly with the fiscal year boundary.
What matters practically is simpler: if you hold the shares on the record date, you collect the full ₹2.30 per share, not one or the other.
Understanding the Record Date — And Why It Isn’t the Date You Buy
This trips up a large number of first-time dividend investors, so let’s be precise about it.
The record date is the cut-off day on which the company examines its shareholder register. Whoever’s name appears on that register on 21 August receives the dividend. Whoever’s name doesn’t, won’t — regardless of how long they held the stock before or how soon they buy after.
The date you actually need to act on is the ex-dividend date, which falls one trading session before the record date under India’s T+1 settlement cycle. Buy the share on or after the ex-date and the trade settles too late for your name to make the register. Buy it before the ex-date, and you’re in.
There’s a related point that catches people out: on the ex-dividend date, the share price typically opens lower by roughly the dividend amount. This isn’t the market punishing the company. It’s arithmetic. The cash is leaving the balance sheet and moving to shareholders, so the share adjusts to reflect a slightly lighter company. Buying a stock purely to capture a dividend and selling immediately afterwards rarely produces the free money it appears to promise.
Reading the Dividend as a Signal
Beyond the cash itself, dividend declarations carry information. A board that commits to returning capital is implicitly signalling confidence in cash generation and comfort with its balance sheet position. Companies under liquidity strain conserve cash; they don’t hand it out. Pairing a dividend with a quarter of near-doubling profit strengthens that read considerably.
That said, ₹2.30 per share is a modest payout in absolute terms. This is a company still deploying capital into a growing FMCG portfolio, not a mature cash cow returning the bulk of its earnings. Investors buying for yield alone should size their expectations accordingly.
Revenue Analysis: ₹11,337 Crore and a Strong Annual Jump
Now to the operating performance.
Revenue from operations came in at ₹11,337 crore for the quarter. Set that against the year-ago figure of ₹8,676 crore and you get an increase of roughly ₹2,661 crore — growth in the region of 30 to 31 percent.
That is a genuinely strong number for a business of this scale. Growing a base of nearly ₹9,000 crore by almost a third in twelve months is not something that happens through minor operational tweaks. It reflects some combination of volume expansion, pricing action, product mix improvement, and distribution reach — and in the edible oil and FMCG categories the company operates in, commodity price movements can amplify reported revenue meaningfully in either direction.
The Sequential Picture
On a quarter-on-quarter basis, revenue moved from ₹11,155 crore to ₹11,337 crore — an increase of roughly 1.6 to 2 percent.
That’s a mild gain rather than a dramatic one, and it should be read as such. Sequential growth of two percent tells you the business held its ground and edged forward. It does not tell you the business accelerated.
Why Year-on-Year Matters More Than Quarter-on-Quarter for FMCG
This is worth pausing on, because it’s the single most common analytical error retail investors make when reading FMCG results.
Fast-moving consumer goods businesses carry seasonality baked into their demand patterns. Festival calendars, monsoon timing, harvest cycles, wedding seasons, summer beverage demand, winter cooking patterns — all of these push volumes around from quarter to quarter in ways that have nothing to do with whether the underlying business is improving.
Compare a festive quarter to a lean quarter and you’ll manufacture a crisis that doesn’t exist. Compare it to the same quarter last year, and you strip the seasonal distortion out entirely, because both periods sat at the same point in the annual cycle.
So when reading Patanjali Foods’ quarter, the ~31 percent year-on-year revenue growth is the number carrying real information. The ~2 percent sequential move is largely noise — useful as a directional check, not as a verdict.
Expenses: Costs Rose, But They Rose Slower Than Revenue
Total expenses for the quarter stood at approximately ₹10,880 crore, against ₹8,530 crore in the year-ago period and ₹10,807 crore in the preceding quarter.
Year-on-year, that’s an increase of about 27.5 percent. Set that beside revenue growth of roughly 31 percent, and you’ve found the engine behind the profit expansion.
The Operating Leverage Story
This gap — revenue growing faster than costs — is what analysts call operating leverage, and it’s arguably the most important dynamic in the entire result.
Here’s why it works. A manufacturing and distribution business carries a substantial base of fixed and semi-fixed costs: plant capacity, machinery depreciation, permanent staff, warehousing, corporate overhead, brand investment. These costs don’t scale one-for-one with sales volume. Once you’re paying for a factory, running it at 85 percent utilisation costs barely more than running it at 70 percent — but it produces materially more output.
So when revenue climbs and a meaningful share of the cost base stays flat, the incremental rupee of sales carries a much higher margin than the average rupee. Profit expands faster than the top line. That’s precisely the pattern in this quarter.
Sequentially, expenses moved from ₹10,807 crore to ₹10,880 crore — an increase of under one percent, against revenue growth of around 1.6 percent. Costs stayed disciplined even as the top line edged higher. That’s a controlled quarter, not a scrambling one.
Operating Profit: The Cleanest Read on the Business
If you want to judge whether a business genuinely improved, operating profit is where you look. It strips out the one-off items, tax quirks and accounting adjustments that can flatter or depress the bottom line.
Operating profit rose from ₹248 crore to ₹453 crore year-on-year — an increase of roughly 83 percent.
Sequentially, it climbed from ₹404 crore to ₹453 crore, a gain of about 12 percent.
Both directions point the same way. This is the number that confirms the quarter was strong at the operating level, not just at the reported level.
Margin Expansion — The Number Behind the Number
Translate those absolute figures into margins and the improvement becomes clearer still:
- Year-ago quarter: ₹248 crore on ₹8,676 crore revenue = operating margin of roughly 2.9%
- Previous quarter: ₹404 crore on ₹11,155 crore revenue = roughly 3.6%
- Current quarter: ₹453 crore on ₹11,337 crore revenue = roughly 4.0%
That is more than 110 basis points of margin expansion year-on-year, and around 40 basis points sequentially.
In a high-volume, thin-margin business — and edible oils are structurally thin-margin — a 110 basis point improvement is substantial. On a revenue base above ₹11,000 crore, every single basis point of margin is worth over ₹1 crore of profit. The margin trajectory here is arguably more meaningful than the revenue headline, because margin gains are harder to achieve and, when they stick, they compound.
The open question is durability. Margin expansion driven by falling input costs can reverse the moment commodity prices turn. Margin expansion driven by better product mix, stronger brands, higher-value FMCG penetration or genuine operating leverage tends to persist. The quarterly numbers alone don’t settle which force dominated here — that answer sits in the segment-level disclosures and management commentary, and it’s the first thing worth checking in the detailed filing.
Net Profit: 86% Growth, and Why the Sequential Drop Is Misleading
Net profit came in at ₹335 crore, against ₹180 crore in the year-ago quarter. That’s growth of roughly 86 percent — profit nearly doubling in twelve months.
Now the number that will confuse people: the previous quarter reported net profit of ₹523 crore. Compared with that, this quarter’s ₹335 crore looks like a sharp 36 percent decline.
It isn’t a decline in business performance. It’s a comparison problem.
What Actually Happened in the Previous Quarter
The preceding quarter’s ₹523 crore figure was inflated by two factors that don’t reflect ongoing operations:
1. Exceptional items. These are one-time entries that sit below the operating line — asset sales, write-backs of earlier provisions, settlements, or other non-recurring events. They land in reported profit for that quarter and then vanish. They tell you nothing about how the business will perform next quarter.
2. Lower tax outgo. The previous quarter benefited from a reduced tax charge. Tax provisions fluctuate for many reasons — timing differences, deferred tax adjustments, credits recognised in a particular period. A lighter tax line lifts reported profit without a single rupee of extra business being done.
The Proof Is in the Operating Line
Here’s the clean test. If the business had genuinely weakened sequentially, operating profit would have fallen too — operating profit sits above exceptional items and above tax, so it’s immune to both distortions.
Operating profit rose sequentially, from ₹404 crore to ₹453 crore.
That settles it. The underlying business improved quarter-on-quarter. The reported net profit fell only because the prior quarter contained one-time boosts that the current quarter doesn’t.
This is a genuinely useful lesson for anyone reading quarterly results: when reported profit and operating profit move in opposite directions, the operating line is telling you the truth about the business, and the gap between them is telling you where the accounting sits.
Net Margin Progression
- Year-ago quarter: ₹180 crore on ₹8,676 crore = ~2.1% net margin
- Current quarter: ₹335 crore on ₹11,337 crore = ~3.0% net margin
Close to a full percentage point of net margin improvement year-on-year. On the ₹11,337 crore revenue base, that improvement alone is worth well over ₹100 crore.
The previous quarter’s ~4.7% net margin should be mentally discounted, since it carried those exceptional gains.
Earnings Per Share: What Shareholders Actually Own
EPS for the quarter stood at approximately ₹3.09, against ₹1.66 in the year-ago period — growth of roughly 86 percent, matching the net profit growth exactly.
That precise match is itself informative. When EPS grows at the same rate as net profit, it confirms the share count stayed stable — no dilution from fresh equity issuance, no share-based expansion diluting existing holders. Every rupee of additional profit flowed through proportionally to existing shareholders.
The previous quarter reported EPS of ₹4.82, reflecting that same exceptional-item-inflated profit figure. As with net profit, treat it as a distorted comparison rather than a benchmark.
For long-term investors, EPS is the number that ultimately drives share price over multi-year periods. Price follows earnings. A business that can grow EPS at these rates sustainably will eventually see that reflected in valuation — the emphasis being firmly on sustainably, since a single quarter establishes a data point, not a trend.
Share Price Context: Strong Numbers Against a Weak Chart
Here’s what makes this result particularly interesting from a market perspective.
Only a few weeks before the results, the stock was trading in the vicinity of its 52-week low. The chart had been telling a story of pessimism, weak sentiment and investor disinterest — while the underlying business, as these numbers now reveal, was delivering nearly 31 percent revenue growth and 86 percent profit growth.
That divergence between price action and operating performance is exactly the situation that creates re-rating opportunities. When a stock sits near its lows, expectations embedded in the price are low. Results that beat those depressed expectations can trigger sharp moves, because the market has to reprice not just the earnings but its entire assumption set about the business.
The important caveat: none of this guarantees anything. Markets weigh far more than a single quarter’s numbers. Valuation multiples, sector sentiment, commodity price outlook, promoter actions, broader market conditions and forward guidance all feed into how a stock responds. Strong results near a 52-week low create conditions for a positive reaction — they don’t create certainty of one.
Anyone watching this should pay attention not just to the immediate price move but to whether volumes accompany it, whether institutional participation shifts, and whether the stock holds any gains over subsequent sessions. A one-day pop on results that fades within a week means something very different from sustained accumulation.
What These Numbers Don’t Tell You
Good analysis includes being honest about the limits of the data. A quarterly results summary leaves several important questions open:
Segment-level performance. Patanjali Foods operates across edible oils and a broader FMCG portfolio with meaningfully different margin profiles. The consolidated numbers don’t reveal which segment drove the growth. A quarter powered by high-margin FMCG expansion is worth considerably more than one powered by edible oil volumes riding a commodity cycle.
Volume versus price. Revenue growth of 31 percent could reflect more products sold, higher prices per product, or a mix of both. Volume-led growth signals genuine demand and market share gains. Price-led growth can evaporate when commodity prices normalise. The distinction is fundamental and the headline number obscures it entirely.
Input cost trajectory. Edible oil businesses live and die by raw material prices, which are driven by global commodity markets, import duties, currency movements and crop cycles — none of which the company controls. Favourable input costs can manufacture margin expansion that reverses without warning.
Working capital and cash flow. Profit is an accounting measure. Cash is a fact. A quarter of strong reported profit accompanied by deteriorating cash conversion or ballooning receivables is a very different quarter from one where cash flow tracks profit closely. The cash flow statement in the full filing answers this.
Debt position and interest costs. Balance sheet health doesn’t show up in a P&L summary but shapes the risk profile substantially.
Management guidance. Forward commentary on demand outlook, capacity expansion, distribution plans and margin sustainability often moves stocks more than the historical numbers themselves.
Anyone taking this result seriously should read the full filing rather than stopping at the headline figures.
What to Watch in the Coming Quarters
If you’re tracking this story forward, here’s the checklist that actually matters:
1. Does the margin hold? The ~4% operating margin is the achievement of this quarter. Sustaining it — or better, extending it — over the next two or three quarters would confirm structural improvement rather than a favourable input cost window.
2. Does revenue growth stay in double digits year-on-year? Growth of 31 percent against a base that’s now materially larger will be harder to repeat. Watch whether growth moderates gracefully or falls off sharply.
3. Does the FMCG mix keep rising? Higher-margin FMCG revenue as a share of total is the long-term margin story. Segment disclosures will show whether that shift is progressing.
4. Does cash flow track profit? Sustained divergence between reported profit and operating cash flow is one of the more reliable early warning signals in equity analysis.
5. Does the dividend cadence continue? Consistent capital returns reinforce the confidence signal. A skipped or reduced payout next cycle would say something.
Key Takeaways from Patanjali Foods’ Q1 Results
To pull the whole picture together:
- Revenue of ₹11,337 crore, up roughly 31 percent year-on-year from ₹8,676 crore, with a modest ~2 percent sequential gain.
- Operating profit of ₹453 crore, up approximately 83 percent year-on-year and 12 percent sequentially — improvement in both directions.
- Net profit of ₹335 crore, up around 86 percent year-on-year; the sequential dip from ₹523 crore is explained entirely by exceptional items and lower tax in the prior quarter, not by business weakness.
- Operating margin expanded from ~2.9% to ~4.0%, a gain of more than 110 basis points — arguably the most significant number in the release.
- EPS of ₹3.09 versus ₹1.66, with no evidence of dilution.
- Total dividend of ₹2.30 per share across two interim declarations, with a record date of 21 August.
- The stock was trading near 52-week lows ahead of the announcement, setting up a meaningful gap between market expectations and delivered performance.
The short version: costs grew slower than sales, margins expanded, profit nearly doubled, and shareholders are getting paid. On the operating fundamentals, this was a good quarter.
Frequently Asked Questions
What is the record date for the Patanjali Foods dividend? The record date is 21 August. Shareholders whose names appear on the company’s register on that date are eligible for both declared dividends.
How much dividend is Patanjali Foods paying per share? A total of ₹2.30 per share — ₹1.50 as the third interim dividend and ₹0.80 as the first interim dividend, both carrying the same record date.
When do I need to buy the shares to receive the dividend? You must purchase before the ex-dividend date, which falls one trading session ahead of the 21 August record date under the T+1 settlement cycle. Buying on or after the ex-date means the trade settles too late for eligibility.
What was Patanjali Foods’ revenue this quarter? Revenue from operations was approximately ₹11,337 crore, compared with ₹8,676 crore in the year-ago quarter and ₹11,155 crore in the preceding quarter.
Why did net profit fall compared with the previous quarter? The previous quarter’s ₹523 crore included exceptional one-time items and benefited from a lower tax charge. Operating profit — which excludes both — actually rose sequentially from ₹404 crore to ₹453 crore, confirming the underlying business improved rather than weakened.
How much did profit grow year-on-year? Net profit grew roughly 86 percent, from ₹180 crore to ₹335 crore. Operating profit grew about 83 percent, from ₹248 crore to ₹453 crore.
What is the EPS for the quarter? Approximately ₹3.09, compared with ₹1.66 in the year-ago quarter — growth of around 86 percent, in line with net profit growth.
Should year-on-year or quarter-on-quarter comparisons be used for FMCG companies? Year-on-year is the more reliable comparison. FMCG demand carries strong seasonal patterns tied to festivals, weather and agricultural cycles, so comparing consecutive quarters mixes seasonal swings with genuine business change. Comparing the same quarter across years removes that distortion.
Where was the share price before these results? The stock had been trading close to its 52-week low in the weeks preceding the announcement, meaning market expectations were subdued heading into the release.
Final Word
Quarterly results reward careful readers. The headline here — profit up 86 percent — is accurate but incomplete. The sequential profit decline, which a superficial reading would treat as bad news, dissolves entirely once you check the operating line and understand what sat in the prior quarter’s numbers.
What’s left is a business that grew revenue by roughly a third, kept cost growth below revenue growth, expanded operating margin by over 110 basis points, and committed to returning capital to shareholders — all while its stock languished near multi-month lows.
Whether the market chooses to reprice that gap, and whether the operating improvement proves durable across the coming quarters, are the two questions worth following from here.
This article is intended for informational and educational purposes only. It summarises and analyses publicly disclosed quarterly figures and does not constitute investment advice, a recommendation, or a solicitation to buy or sell any security. Figures are rounded and drawn from the reported results; readers should verify all data against the company’s official filings with the stock exchanges. I am not a registered investment adviser. Please consult a SEBI-registered financial adviser before making investment decisions, and be aware that equity investments carry the risk of capital loss.