


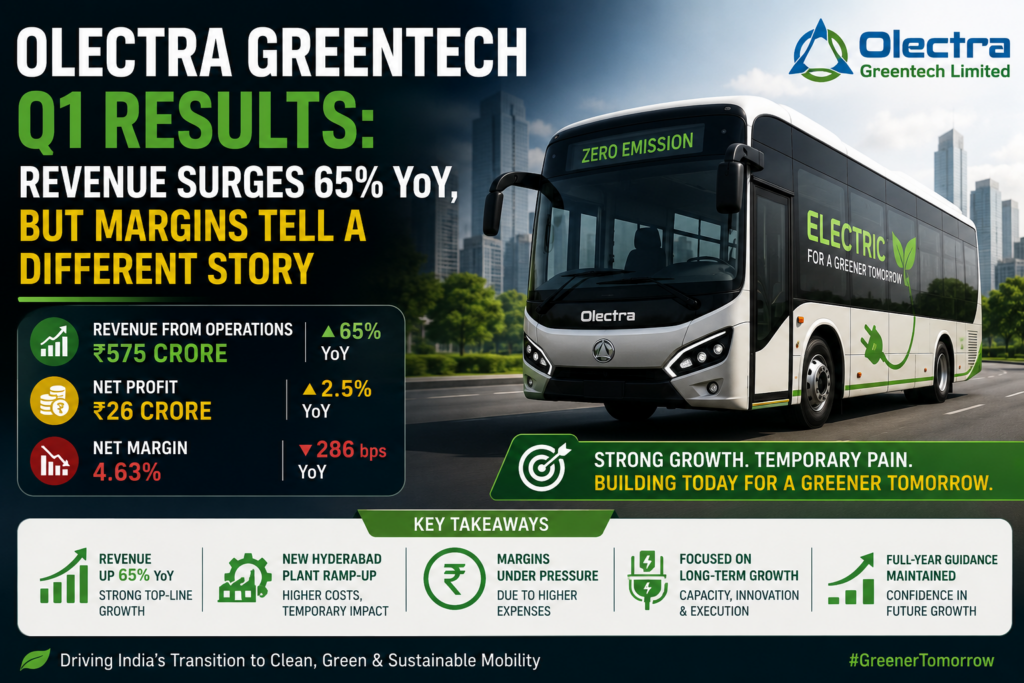
Olectra Greentech has released its Q1 numbers, and the report card splits neatly into two halves. On one side sits a revenue line that has expanded by roughly two-thirds compared to the same quarter last year. On the other side sits a profit line that has barely moved, a margin that has almost halved, and an expense figure that has raced ahead of everything else.
Headlines will call the quarter weak. Investors who understand how an electric bus manufacturer actually earns money will read it differently. Below, I break down every line item disclosed in the filing, explain the mechanics behind the margin squeeze, and lay out exactly what management has promised for the year ahead.
Olectra Greentech Q1 Results at a Glance
Here is the full quarterly snapshot, compared both year-on-year (YoY) and quarter-on-quarter (QoQ):
| Metric | Current Quarter | Year-Ago Quarter | Previous Quarter | YoY Change | QoQ Change |
|---|---|---|---|---|---|
| Revenue from operations | ₹575 crore | ₹347 crore | ₹644 crore | +65% | −11% |
| Total expenses | ₹545 crore | ₹321 crore | ₹571 crore | +70% | −5% |
| Net profit | ₹26 crore | ₹26 crore | ₹57 crore | +2.5% | Sharp decline |
| Net margin | 4.63% | 7.49% | 8.90% | −286 bps | −427 bps |
| EPS | ₹3.16 | ₹3.17 | ₹6.76 | Flat | Sharp decline |
Read that table once and the story writes itself: the company sold far more, spent proportionally more, and kept almost nothing extra.
Revenue Jumps to ₹575 Crore — The Strongest Line in the Report
Revenue from operations landed at ₹575 crore for the quarter, against ₹347 crore in the corresponding quarter of the previous financial year. That works out to an expansion of approximately 65% year-on-year.
For a capital goods manufacturer, a 65% top-line jump in a single year is not incremental growth. It signals that production capacity has genuinely expanded and that deliveries have accelerated meaningfully. Buses are large-ticket items with long build cycles; revenue only moves this sharply when physical units actually roll out of the gate and get handed over to customers.
This is the number that long-term shareholders will care about most, because it is the leading indicator. Profit follows volume in this business — not the other way around.
Why the 11% Quarter-on-Quarter Dip Is Misleading
Against the immediately preceding quarter, revenue slipped from ₹644 crore to ₹575 crore, a decline of roughly 11%. Taken in isolation, that looks like momentum reversing.
It isn’t, and here’s why.
Olectra Greentech builds electric buses. Bus procurement in India runs on tender cycles, state transport undertaking (STU) budgets, and government delivery schedules — none of which distribute themselves evenly across four quarters. Orders arrive in lumps. Deliveries cluster. A quarter that closes a large delivery batch will always look stronger than the quarter that opens a new one.
There is also a seasonal layer. The company manufactures air-conditioned electric buses, and demand patterns for those units shift with the calendar and with how state authorities time their fleet inductions. Comparing one quarter directly against the quarter before it flattens all of that structure into noise.
The correct lens for this company is year-on-year, not quarter-on-quarter. Judged that way, the business has grown substantially. Judged the other way, you would conclude the wrong thing for the wrong reason.
Expenses Climb to ₹545 Crore — And There’s a Reason
Total expenses for the quarter came in at ₹545 crore, versus ₹321 crore in the year-ago quarter and ₹571 crore in the preceding quarter.
Notice the ratio. Revenue rose 65% year-on-year. Expenses rose approximately 70%. When your cost base grows faster than your revenue base, every rupee of extra sales delivers less profit than the rupee before it. That single relationship explains almost everything else in this results sheet.
So what pushed costs up faster than sales?
The most significant factor is capacity. The company’s Hyderabad manufacturing facility came online relatively recently, and a newly commissioned plant carries a very specific cost signature in its first few quarters of operation:
- Fixed overheads land in full, immediately. Depreciation on the new facility, plant maintenance, utilities, and facility management costs all hit the P&L from day one, whether the line runs at 40% utilisation or 90%.
- Workforce costs run ahead of output. You hire, train, and pay a full shift crew before that crew reaches peak productivity. Learning-curve inefficiency is a real, measurable cost.
- Ramp-up wastage is normal. Early production batches from a new line typically carry higher scrap rates, more rework, and slower cycle times than a mature line.
- Input procurement lacks scale leverage initially. Bargaining power with suppliers improves as sustained volumes build, not on the day the plant opens.
In other words, the company is currently paying the full fixed cost of a capacity base it has not yet fully filled. That is a temporary structural condition, not a permanent operational flaw — provided volumes actually arrive to fill it.
Net Profit Stays Flat at ₹26 Crore
Net profit for the quarter stood at approximately ₹26 crore. In the year-ago quarter, it was also approximately ₹26 crore. The year-on-year change works out to roughly 2.5%.
This is the number that will dominate the headlines, and rightly so. Revenue grew 65%. Profit grew 2.5%. The gap between those two figures is the entire investment debate around this stock compressed into one line.
Against the preceding quarter, the deterioration is steeper still: profit fell from ₹57 crore to ₹26 crore, a decline of more than half.
For a growth-stage manufacturer, flat profitability during a capacity expansion phase is not automatically alarming — it is, in fact, the textbook pattern. Companies that scale hard almost always pass through a period where the cost of new capacity outruns the revenue that capacity generates. The critical question is duration, not existence. A two-quarter squeeze is a ramp. A six-quarter squeeze is a problem.
Margin Compression: From 7.49% to 4.63%
The margin picture is where the pressure becomes most visible.
- Year-ago quarter net margin: 7.49%
- Preceding quarter net margin: 8.90%
- Current quarter net margin: 4.63%
That is a contraction of roughly 286 basis points year-on-year and roughly 427 basis points sequentially. The company is now converting less than five paise of every rupee of revenue into net profit, down from nearly nine paise just one quarter earlier.
Three forces typically drive this kind of compression in an EV bus manufacturer:
1. Operating deleverage from underutilised new capacity. As described above, fixed costs spread across insufficient volume mechanically compress margins. This reverses automatically as utilisation improves — it is the single most reversible cause on this list.
2. Order-mix economics. Not every bus contract carries the same margin. Large-volume government and STU tenders are frequently won on aggressive pricing, trading margin percentage for volume certainty and multi-year revenue visibility. If the current quarter’s delivery mix skews toward lower-margin, high-volume contracts, the blended margin falls even when the business is healthy.
3. Input and component costs. Battery packs, power electronics, and drivetrain components represent a large share of an electric bus’s bill of materials. Movement in cell prices, import costs, or currency can move gross margin before any operational factor gets a chance to.
The company has not attributed the compression to a single cause, and realistically it is a blend of all three.
EPS Holds at ₹3.16
Earnings per share came in at approximately ₹3.16, essentially unchanged from ₹3.17 in the year-ago quarter, and down sharply from ₹6.76 in the preceding quarter.
EPS mirrors the profit line exactly here, which itself is informative — it indicates that the equity base has not been meaningfully diluted over the period. Growth has not come at the cost of existing shareholders’ proportional ownership. For a company in an aggressive capacity expansion phase, funding that expansion without heavy dilution is a point in its favour, even in a quarter this soft.
The Hyderabad Plant: The Reason Behind Both the Growth and the Squeeze
Here is the single most important interpretive point in this entire results analysis.
The Hyderabad facility is simultaneously the reason revenue grew 65% and the reason margins fell to 4.63%.
These are not two separate stories. They are one story observed at two different points in the P&L. The plant added the manufacturing capacity that made higher deliveries possible. The same plant added the fixed cost base that made those deliveries less profitable per unit than before.
That framing matters enormously for how you read the quarter. If revenue had grown 65% while margins collapsed without a corresponding capacity addition, that would signal a genuine competitive or pricing problem — the company buying growth at any cost. Instead, the margin decline has a specific, identifiable, and finite cause attached to an asset that will produce for years.
The test is straightforward, and it is entirely measurable over the next few quarters: as plant utilisation rises, do margins recover? If yes, this quarter was a ramp cost. If no, the problem lies elsewhere in the business model.
Management Guidance: 2,500 Buses Targeted for FY27
The forward-looking commentary from management is arguably more consequential than the reported numbers themselves.
Management has set a delivery target of 2,500 buses for FY27, against roughly 1,250 buses delivered in FY26. That is a targeted doubling of physical output in a single financial year.
Consider what that implies at the revenue line. If the company achieves the stated delivery target, revenue would roughly double from the base it recorded in the most recent quarter — assuming realisation per bus holds broadly steady and the delivery schedule spreads reasonably across the year.
This guidance also retroactively justifies the expense build. You do not staff, tool, and commission capacity for 2,500 units and then report the cost structure of a 1,250-unit business. The elevated cost base visible in this quarter’s numbers is, at least in part, the cost of preparing for the volume management has committed to.
Naturally, guidance is a statement of intent, not a guarantee. Execution risk on a 100% volume increase is real, and delivery targets in the bus segment depend heavily on tender awards, customer readiness, charging infrastructure availability at the buyer’s end, and component supply chains holding up under doubled throughput.
Management Had Already Warned About H1 Margin Pressure
Critically, this quarter’s margin weakness was not a surprise to anyone who listened to prior management commentary.
Management had indicated in advance that:
- Q1 and Q2 would carry margin pressure and see profitability constrained
- H2 would show meaningful improvement as operations stabilised and volumes built
That is precisely what has materialised. The direction of the outcome matches the guidance. The magnitude, however, ran somewhat harsher than the commentary implied — margins at 4.63% represent a steeper fall than “some pressure” would ordinarily suggest, and that overshoot is a legitimate negative in an otherwise explainable quarter.
So the honest scorecard on management credibility reads: directionally accurate, quantitatively optimistic. They correctly called the shape of the year. They understated the depth of the trough.
How to Read This Quarter: Weak Headline, Explainable Structure
Strip away the noise and the quarter resolves into a clear set of positives and negatives.
What Went Right
- Revenue expanded 65% year-on-year — the strongest possible evidence that capacity expansion has translated into actual deliveries
- New Hyderabad capacity is contributing to the top line, not sitting idle
- EPS held flat with no visible dilution, indicating growth funded without meaningfully diluting existing shareholders
- The margin decline has an identifiable, finite cause rather than an unexplained one
- Management guidance for FY27 implies a doubling of delivery volumes, backed by a stated numerical target
What Went Wrong
- Margins compressed to 4.63%, down from 7.49% a year ago and 8.90% sequentially — a steep, visible deterioration
- Profit stayed flat despite 65% revenue growth, meaning growth generated essentially no incremental earnings this quarter
- Expenses grew faster than revenue (approximately 70% versus 65%), which is the arithmetic root of the entire problem
- The margin fall exceeded management’s own prior signalling, raising a fair question about forecasting precision
- Sequential declines across revenue, profit, margin, and EPS create a genuinely soft optical presentation
The Central Question
Everything reduces to one question: is this a temporary ramp-up cost or a permanent structural margin reset?
The bull case says operating leverage kicks in as the Hyderabad plant fills up, fixed costs spread across doubled volumes, and margins normalise toward historical levels — exactly as management has guided for H2.
The bear case says the company is winning large-volume government tenders at pricing that structurally cannot support the margins it used to earn, and that 4.63% is closer to the new normal than to a temporary trough.
The next two quarters of results will settle this argument with data rather than opinion. That is when guidance stops being a promise and starts being a track record.
Key Metrics to Track in the Next Results
Rather than reacting to any single quarter, monitoring these specific indicators will tell you which scenario is playing out:
- Sequential margin trajectory. Does net margin recover from 4.63% toward the 7–9% band, or stabilise near current levels?
- Delivery volume run-rate. Is the company tracking toward the 2,500-bus FY27 target on a quarterly pro-rata basis, or falling behind schedule?
- Expense growth versus revenue growth. The moment revenue growth outpaces expense growth, operating leverage has arrived and margins will follow.
- Order book additions. New tender wins determine revenue visibility 12–24 months out — far more predictive than the current quarter’s realised revenue.
- H2 performance against explicit guidance. Management has publicly committed to improvement in the second half. This is now a testable, falsifiable claim.
- Capacity utilisation disclosures. Any commentary on how full the Hyderabad plant is running directly answers the operating-leverage question.
- Working capital and receivables. Government and STU contracts frequently carry extended payment cycles; rapid volume growth can strain cash flow even when the P&L looks fine.
The Broader Context: India’s Electric Bus Transition
None of these numbers exist in isolation. Olectra Greentech operates in a segment shaped by policy, and the direction of that policy has been consistently supportive.
Indian state transport undertakings have been progressively electrifying their fleets, driven by a combination of central government incentive programmes, state-level EV policies, urban air-quality mandates, and the increasingly favourable total-cost-of-ownership maths of electric buses against diesel over a full vehicle lifecycle. Public bus fleets are an unusually good fit for electrification — fixed routes, predictable daily distances, depot-based overnight charging, and high daily utilisation that amplifies fuel-cost savings.
For manufacturers positioned in this segment, that creates a demand environment with genuine multi-year visibility. It also creates the specific margin dynamic visible in this quarter, because government tender processes are competitive and price-sensitive by design. High volume and high margin rarely arrive in the same contract.
This is the structural trade-off the company has effectively chosen: scale and revenue visibility now, with the expectation that operating leverage and manufacturing efficiency restore profitability later. Whether that bet pays off is precisely what the next few quarters will reveal.
Frequently Asked Questions
What was Olectra Greentech’s revenue in Q1? Revenue from operations came in at ₹575 crore, compared with ₹347 crore in the year-ago quarter and ₹644 crore in the preceding quarter — a year-on-year increase of approximately 65% and a sequential decline of approximately 11%.
How much profit did Olectra Greentech report? Net profit was approximately ₹26 crore, essentially flat against the ₹26 crore reported in the same quarter last year, and down from ₹57 crore in the preceding quarter.
Why did Olectra Greentech’s margins fall? Net margin fell to 4.63% from 7.49% a year ago and 8.90% sequentially. The primary driver is that total expenses rose approximately 70% year-on-year while revenue rose approximately 65%. The recently commissioned Hyderabad plant contributes fixed costs — depreciation, staffing, utilities, ramp-up inefficiency — in full before reaching optimal utilisation, which mechanically compresses margins during the ramp phase.
What was Olectra Greentech’s EPS? Earnings per share stood at approximately ₹3.16, versus ₹3.17 in the year-ago quarter and ₹6.76 in the preceding quarter.
Why did revenue fall quarter-on-quarter? Bus manufacturing revenue is inherently lumpy. Deliveries depend on tender schedules, state transport undertaking budget cycles, and customer readiness — none of which distribute evenly across quarters. The company also builds air-conditioned buses, where demand carries a seasonal element. Year-on-year comparison is the more meaningful measure for this business.
What is Olectra Greentech’s delivery guidance for FY27? Management has targeted 2,500 bus deliveries in FY27, against approximately 1,250 buses delivered in FY26 — a targeted doubling of output.
Did management anticipate this weak quarter? Yes, at least directionally. Management had signalled in advance that Q1 and Q2 would face margin pressure with improvement expected from H2 onward. The reported outcome matches that direction, though the extent of the margin decline exceeded what the prior commentary implied.
Is the margin decline permanent? That remains unresolved. If it stems from operating deleverage at a newly commissioned plant, margins should recover as utilisation rises. If it stems from structurally lower pricing on large government tenders, current margins may prove closer to a new baseline. Tracking sequential margin movement over the next two to three quarters is the way to distinguish between the two.
The Bottom Line
Olectra Greentech’s Q1 delivers a genuinely mixed result, and both halves of it deserve equal weight.
Revenue growth of 65% year-on-year confirms that the capacity expansion is real and that deliveries are scaling. Flat profit and a margin drop to 4.63% confirm that the company is currently paying for that expansion rather than harvesting it.
The reassuring element is that these two facts share a single cause — the Hyderabad plant — rather than representing two independent problems. The concerning element is that the margin fall outran management’s own advance signalling, which raises reasonable questions about the precision of the H2 recovery forecast.
Management has now made a specific, measurable, publicly testable commitment: 2,500 buses in FY27 and improved performance from the second half onward. Those are not vague aspirations; they are numbers that the next set of results will either validate or contradict.
Until then, the quarter is best understood as a transition quarter — the point where the cost of building capacity has fully landed on the P&L but the revenue from filling that capacity has only partially arrived. Whether that gap closes as promised is the entire investment thesis, and it will be answered by data rather than commentary.
This article summarises and analyses publicly disclosed quarterly financial figures for informational purposes only. It is not investment advice, and it is not a recommendation to buy, sell, or hold any security. Financial figures are as stated in the source material and should be verified against the company’s official filings and investor communications before any decision. Please consult a SEBI-registered investment adviser regarding your personal circumstances.